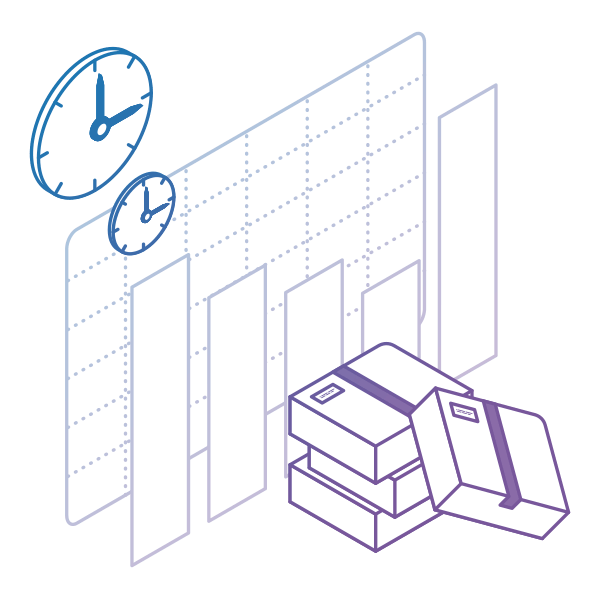
If traffic flows smoothly, everyone reaches their destination on time. However, if there are traffic jams or roadblocks, progress grinds to a halt. The efficiency of your team's workflow works in much the same way. It’s a vital indicator of whether your processes are stable and whether any blockers or delays are slowing down your team.
This metric is essential in Lean management. It helps you determine precisely where your processes need improvement and where to focus your efforts. Just as a traffic report highlights trouble spots on the road, tracking your workflow efficiency reveals the weaknesses that impact your team's performance.
Accurately tracking your workflow efficiency can be straightforward and will reveal your weaknesses and their impact on your team's performance. This article will discuss flow efficiency and how to measure it effectively to ensure your work processes run smoothly.
What Is Flow Efficiency?
Flow efficiency measures the ratio between value-adding time and the lead time required to complete a process. Value-adding time occurs when a person or machine is actively working towards completing a task. Lead time, on the other hand, is the duration from when an order is placed to when the product is delivered. Tracking your team's workflow efficiency is crucial for optimizing the entire process.
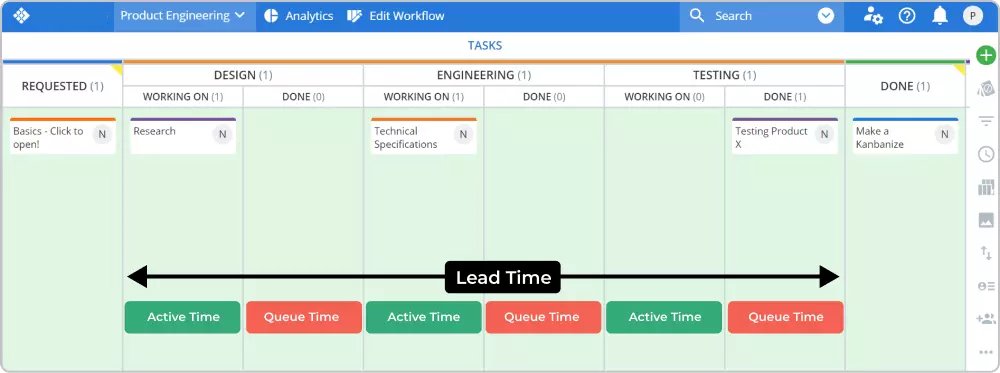
 Visualization of the active and waiting stages/queues of a work process
In Lean management, waiting is one of the key non-value-adding activities, often referred to as one of the seven wastes. This waiting time can be divided into two categories:
-
Wait Time accumulates when a task is delayed due to factors beyond the control of the person working on it. For instance, in a Kanban system, wait time might occur when a card is pending review before moving to the next column on the kanban board.
-
Blocked Time, on the other hand, arises when an assignment gets stuck in the workflow due to an obstruction. This could be due to various reasons, such as waiting for another team member to become available or waiting for a repair team to fix a hardware or software issue.
The primary difference between these two types of waste is whether the inactive time is expected or unexpected. Expected delays are classified as wait time, whereas unexpected delays are considered blocked time.
Understanding how much time is wasted waiting provides valuable insights into where process improvements are needed to achieve greater Lean efficiency. Identifying and addressing these inefficiencies can significantly enhance workflow and overall productivity.
See work. Fix flow. Deliver faster.
How to Measure Flow Efficiency?
Measuring the efficiency of a process is done with the help of the flow efficiency formula:
-
Value added time = Cycle Time - Non-value-added time
-
Non-value-added time = Wait time + Block Time
Take the following example of flow efficiency: If one of your software engineers needs 5 days to complete a feature but only spends one day actively working on it, the flow efficiency for developing this particular feature is:
Flow Efficiency % = (1 day / 5 days) * 100 = 20%.
Calculating this manually for every task in your workflow can create more waste than value, which contradicts Lean management principles. Considering all the factors affecting flow efficiency, this process becomes even more cumbersome.
Thankfully, with digital kanban software or other workflow management tools, you can track flow efficiency effortlessly, saving valuable time and ensuring you maintain an efficient workflow. This tool automates the tracking process, providing you with accurate data without the need for manual calculations.
Tools for Calculating the Flow Efficiency in Businessmap
Businessmap's solution provides tools to monitor process efficiency and supply leaders with data to accelerate delivery without sacrificing quality, including the Flow Efficiency chart and the Process Efficiency widget.
The Flow Efficiency Chart: A Strategic Tool for Optimizing Workflow
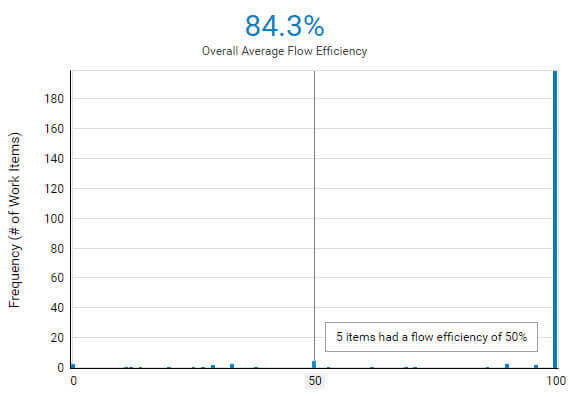
The Flow Efficiency chart in Businessmap is a powerful tool that measures your workflow efficiency in precise detail over a specified period, offering invaluable insights for achieving Lean efficiency in your work processes.
The chart automatically gathers data from every card that moves through your work boards within your chosen time frame, calculates the overall flow efficiency, and visualizes the results for straightforward interpretation.
One of the standout benefits of using the Flow Efficiency chart is the array of workflow filters at your disposal. You can effortlessly include or exclude additional factors like blocked time or focus on specific stages of your team’s workflow. This flexibility allows you to monitor various aspects of your flow’s efficiency with just a few clicks, providing critical data on where improvements are needed.
Visualizing work process and queue stages using the Flow Efficiency chart in Businessmap
With these insights, you can identify redundant stages in your workflow or confirm the necessity of new steps to boost efficiency and enhance overall performance. Additionally, you'll be able to track your team's personal efficiency levels, uncovering strengths and weaknesses to refine your processes further.
Process Efficiency Widget: Get an Instant Overview of the Efficiency Stats You Need
With the help of our project portfolio management platform, you can monitor flow efficiency from the Main dashboard using our specifically designed Process Efficiency widget. It is highly customizable, and you can get a quick overview of the efficiency stats you wish to track, making it easy to monitor your process efficiency. By measuring efficiency in your process, teams can analyze performance, identify bottlenecks, remove waste, and improve their workflows seamlessly.
Process efficiency widget indicating the efficiency of four different teams on a management board in Businessmap
The predefined Process Efficiency Widget simplifies efficiency measurement by calculating the ratio between the actual value-adding time and the lead time required to complete those tasks. Additionally, it provides insights into whether your efficiency has improved or regressed compared to the previously selected period, ensuring you easily stay on top of your process performance.
Businessmap is the most flexible software
to gain full work visibility across teams & portfolios
In Summary
Flow efficiency is the ratio between value-adding time and lead time. Measuring it will help you:
- Understand whether you are improving or not
- Visualize how much time goes to waste waiting on something
- Get insights where you need to improve your process


 Visualization of the active and waiting stages/queues of a work process
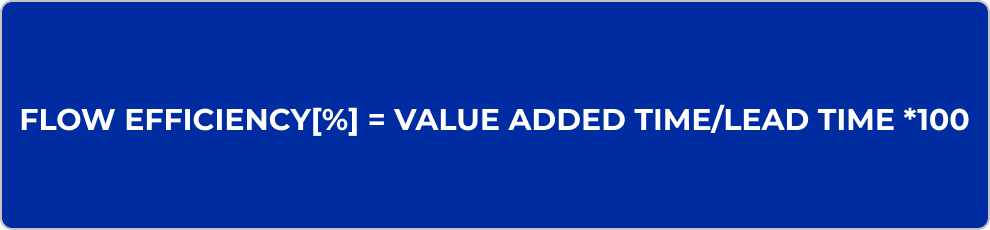
 Visualizing work process and queue stages using the Flow Efficiency chart in Businessmap
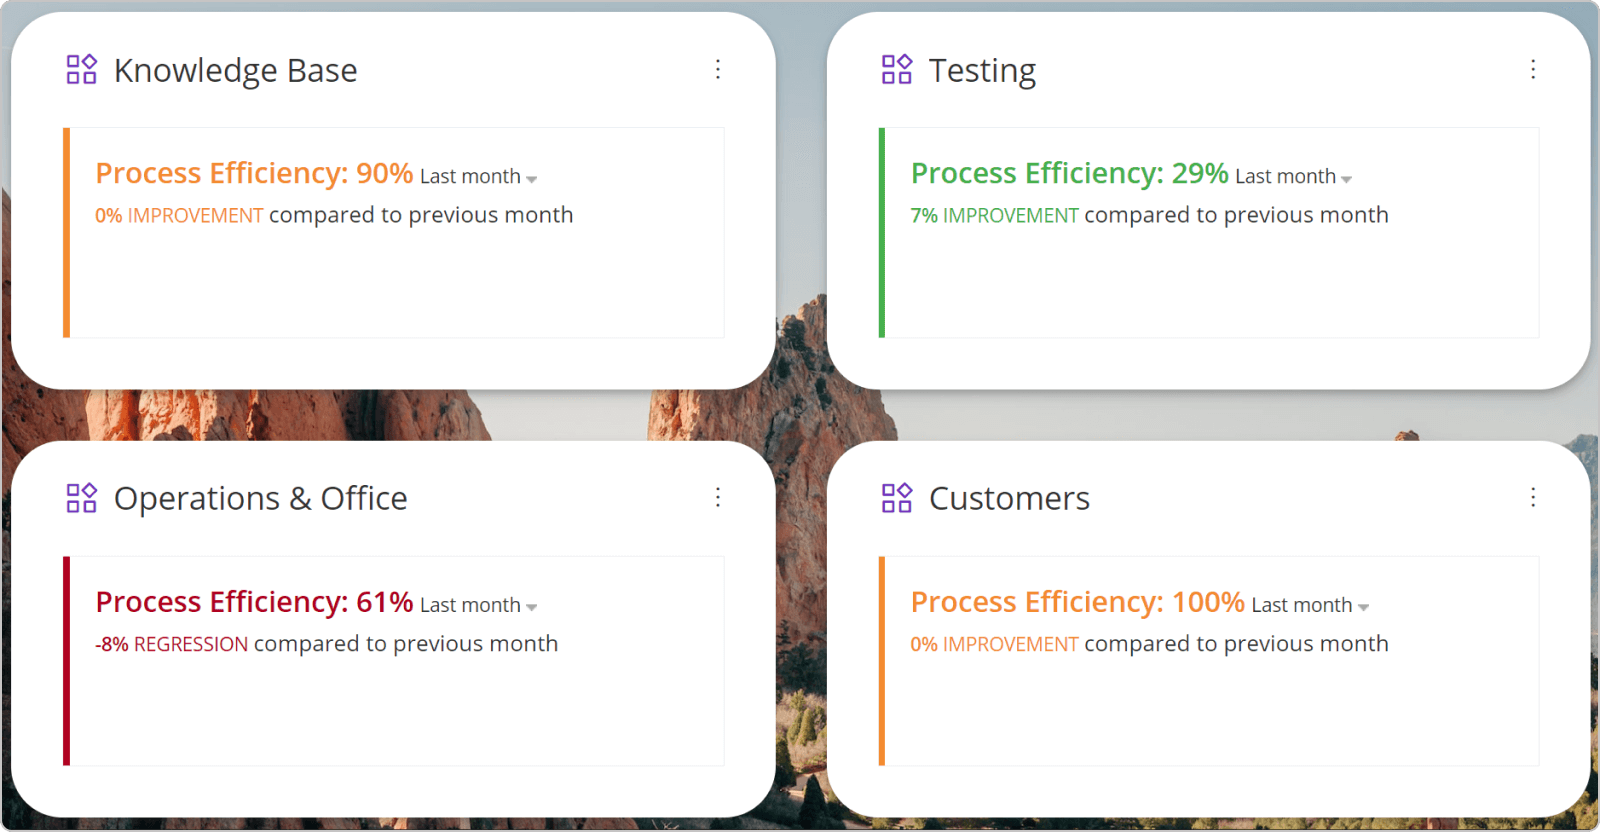 Process efficiency widget indicating the efficiency of four different teams on a management board in Businessmap