Understanding how work progresses from concept to completion is crucial in project management. By monitoring work in progress (WIP), you can identify outliers and maintain a stable workflow.
As a manager, you may initially struggle to determine which analytics and metrics to track and how to extract data to demonstrate performance improvement. One of the first metrics to monitor how work in progress (WIP) is aging in your process.
Understanding Work in Progress (WIP) in Lean Project Management
Work in progress (WIP) is a crucial flow metric that offers valuable insights into the effectiveness and efficiency of a process or system used to deliver customer value. It indicates the amount of active work within your system and helps you understand how work progresses through different stages in your workflow.
The Importance of Limiting Work in Progress (WIP) in Lean Project Management
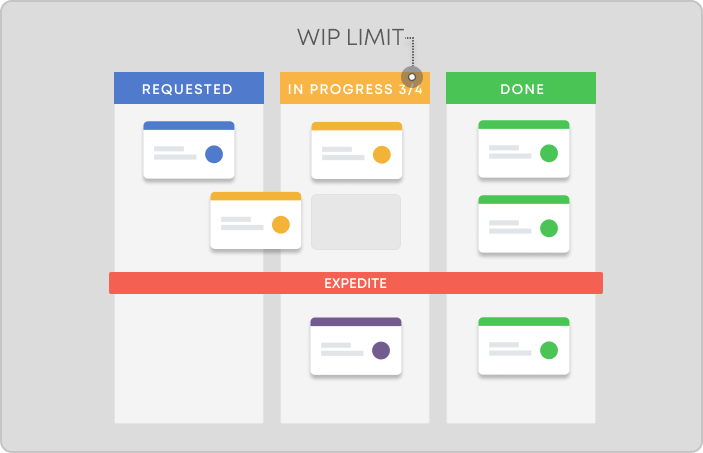
Limiting work in progress is essential for implementing Lean management, which aims to minimize waste and enhance efficiency. In addition, using a Kanban project management board makes work visible and organized, further aiding this process.

The Kanban method emphasizes the importance of shorter cycle times. To achieve this, it's important to apply WIP limits to your project and structure your board to reflect your workflow accurately. Effective flow management, a key component of solid WIP management, ensures timely delivery.
In Lean management, shorter cycle times mean more items can be produced within a given period. Setting WIP limits helps your team minimize multitasking and avoid constant context switching, which can impede productivity.
However, simply setting WIP limits is not enough to guarantee higher productivity. The build-measure-learn cycle, a fundamental principle of Lean, fosters a culture of continuous improvement (kaizen). After establishing your project board, it's crucial to measure key performance indicators and track how these actions impact your results. This ongoing measurement is essential for further improving your processes.
Why Do You Need to Track Aging WIP in Project Management?
Tracking aging WIP (Work in Progress) is crucial for analyzing your workflow and visualizing the progression of tasks from request to completion. Different tasks spend varying amounts of time in each process stage, making it important to identify where slowdowns occur to understand the reasons and find ways to improve.
By tracking this data, you gain insights into your team's past performance in similar contexts. In addition, continuously measuring WIP offers visibility into team's real work capacity. These statistics are valuable for setting new strategic goals, engaging in informed discussions with high management, and fostering productive team conversations.
See work. Fix flow. Deliver faster.
How to Use Aging WIP Chart?
An easy way to monitor aging WIP is by using the aging WIP chart, available in some professional project management software, such as Businessmap. This tool simplifies WIP analysis by resembling your team’s board, extracting data from it, and presenting a clear summary of your flow.
Every aging WIP chart contains the following elements:
-
Columns (Horizontal Axis): Represents all stages of the process, corresponding to the columns on your board.
-
Age (Left Vertical Axis): Shows the number of days each task has spent in its current stage.
-
Pace Percentiles (Right Vertical Axis): Indicates the pace at which tasks are being completed.
-
Tasks (Dots in the Chart): Each dot represents a task, showing its current stage and age.
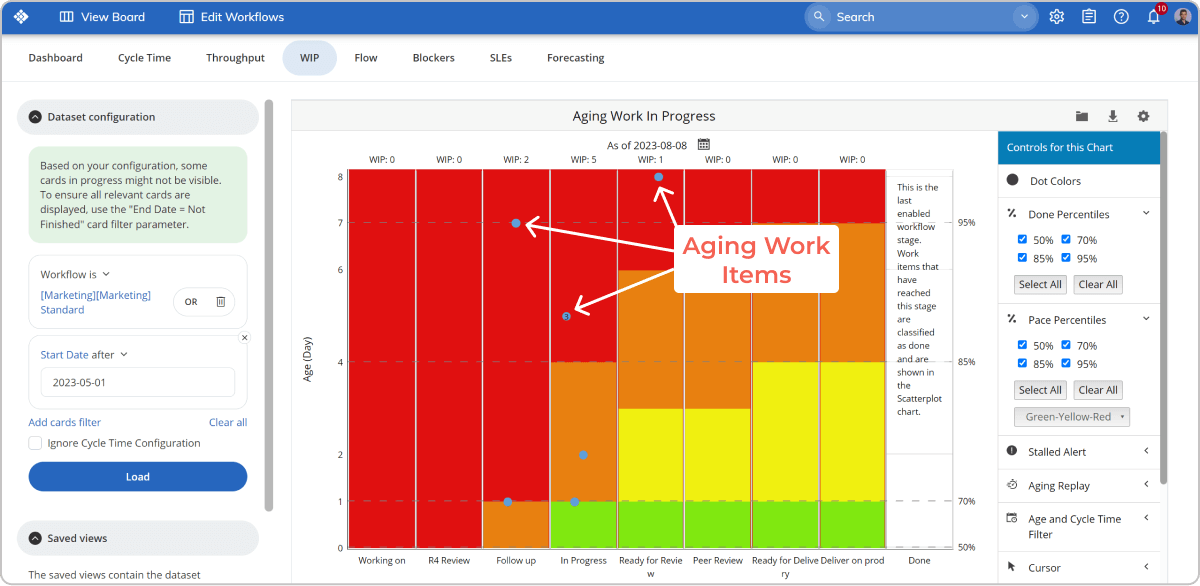
Above each column on the horizontal axis, a WIP indicator displays the number of tasks in progress at each stage.
The vertical axis visualizes how long each task has spent in that section in days.
Aging Work In Progress (WIP) chart used in Kanban project management
The image above features multiple columns representing different stages of a marketing team workflow, with dots indicating tasks and their duration in each stage. The left vertical axis shows the age of tasks in days, while the right vertical axis displays pace percentiles.
For a deeper understanding, more detailed information and instructions are available in the article on Aging WIP.
How to Read the Aging WIP Data?
Drawing Conclusions from Aging WIP Data
By tracking which tasks take the longest to complete, you can draw valuable conclusions. For instance, if a specific employee needs more time, they might require extra training.
Identifying and Solving Problems
You may also discover issues with the setup of your project board, such as certain columns not being optimally organized, causing slowdowns. For example, a review column with a too high WIP limit might disrupt the flow.
Preventing Delays
To prevent delays, it is a good practice to set automatic messages for assignees of tasks that have spent more than the usual time in the "In Progress" area. These messages could suggest breaking down tasks into smaller ones to pass through the funnel faster, preventing clogging the process by filling the WIP limits.
Watch the video below to enhance your understanding of WIP management further and why it matters to improve your team's efficiency.
Use Case: The Benefits of Tracking Work in Progress at Flapper
The technology team at Flapper, an Air Taxi charter marketplace, faced several challenges, including unprioritized requests coming through multiple channels, numerous incomplete activities, and frequent switching of tasks due to urgency.
By mapping their workflow and analyzing historical data, they identified consistently high work in progress (WIP), averaging 80 weekly items. Under professional guidance, they established initial policies to limit WIP, which evolved. This immediate action significantly reduced their average WIP, demonstrating the effectiveness of limiting WIP in improving efficiency. Additionally, the Aging WIP chart proved invaluable for conducting daily meetings and understanding changes in metrics, further enhancing workflow management.
→ Read the full Flapper Case Study
Combining Aging WIP with Other Metrics to Enhance Process Management
To maintain a healthy Lean process, combine the aging WIP metric with other indicators such as the cumulative flow diagram, Monte Carlo simulations, and throughput histogram. Experimenting with these analytics can uncover powerful insights and greatly benefit your workflow.
By doing so, you can give your build-measure-learn feedback loop a whole new meaning, fostering continuous improvement and efficiency in your project management.
Businessmap is the most flexible software
to gain full work visibility across teams & portfolios
In Summary
Work in progress analysis is essential for efficient project and work management and is one of the most important Kanban metrics. An aging WIP chart can help you understand your workflow and identify why and where the process is slowing down. If you want to ensure a healthy flow, you need to monitor your aging WIP together with cycle time and throughput.
- Monitoring aging WIP allows you to identify causes for inefficiency.
- The Aging WIP chart extracts data from your kanban work board and presents it in a concise visual way to summarize your flow.
- The data lets you easily get an idea of how your team performed in similar contexts in the past.


 Aging Work In Progress (WIP) chart used in Kanban project management