Delivering value faster isn't just a nice-to-have - it's a competitive necessity. But in modern organizations, the real question isn't "Are we delivering?" It's "Are we delivering the right things and getting better at it?"
To answer that, you need to track two things:
-
Outcomes: Whether your work delivers the intended business results
-
Flow: How efficiently work moves through your system
This chapter breaks down how to measure both flow and outcomes across all three Flight Levels - strategy (FL3), coordination (FL2), and execution (FL1). You'll learn what to measure, how to link delivery to outcomes, and how to use Businessmap to track and act on the right metrics.
Deliver Outcomes, Not Just Tasks
Most organizations track delivery as a proxy for progress, focusing on deadlines met, tasks completed, and budgets hit. But these metrics don't reveal if your strategy is actually working.
In a company like our example - a commercial drone manufacturer scaling multiple sustainable product lines across engineering, compliance, and R&D - success doesn't come from completing projects. It comes from:
- Reducing time to market
- Meeting sustainability targets
- Improving system reliability
- Hitting outcome-based goals across business units
To measure that, you need metrics aligned to flow and outcomes at every level of the organization.
What Metrics Should You Use at Each Flight Level?
Not all metrics belong in the same place. Flight Levels help you structure measurement where it matters.
Flight Level 3: Measure Strategic Outcomes
At the strategic level, you're tracking business goals and their progress - not task completions. These include OKRs, KPIs, or long-term business outcomes.
Example: One of the drone company's strategic OKRs is to "Achieve 99.8% drone uptime by 2026."
To track this:
- Define outcomes like "30% reduction in in-field hardware failures"
- Link initiatives to these outcomes (e.g., hardware redesigns, new testing protocols)
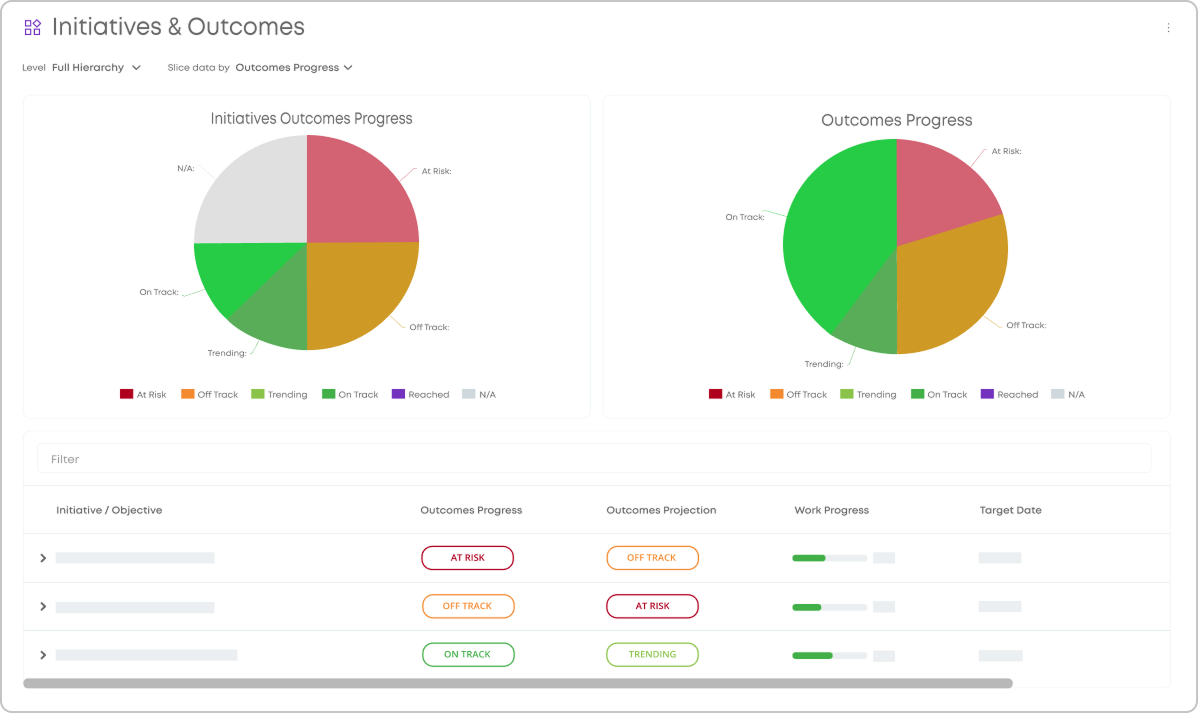
- Use Businessmap's Initiatives & Outcomes (Flight Items & Outcomes) Dashboard to see what's on track, at risk, or falling behind.
With the Initiatives & Outcomes dashboard, leaders can:
- Monitor outcome progress across business units
- Compare initiative completion vs. goal progress
- Spot where strategic efforts are not translating into results
The dashboard becomes your command center for decision-making.
 An executive Initiatives & Outcomes dashboard in Businessmap
Flight Level 2: Monitor Coordination Signals
At FL2, the focus shifts from vision to cross-team orchestration. This is where you manage flow of initiatives and surface coordination risks.
Example: The company is coordinating an initiative to "Implement AI-Driven Predictive Maintenance with IoT Monitoring to Maximize Drone Uptime." across Engineering, Cloud Infrastructure, and QA teams.
Key FL2 metrics:
- Project Lead Times
- Off Track & On Track Metrics
- Number of Blockers & Their Reason
- Project Throughput
In Businessmap:
- Use Portfolio Boards to track initiatives' progress across teams in real time
- Visualize and analyze blockers via the Blocker Clustering chart
Analyzing process blockers using the Blocker Clustering chart in Businessmap
- Monitor the average throughput trend alongside lead time to gain insight into both the consistency and overall value delivery speed within your system.
These metrics feed directly into FL3 outcomes - and help you take action before strategic delivery derails.
Flight Level 1: Track Flow Metrics for Delivery Teams
This is where teams get work done. The focus is on workflow stability, predictability, and speed.
Key flow metrics to track:
-
Cycle Time: How long does work take from start to finish?
-
Throughput on a Task Level: How much work is delivered over time?
-
Work In Progress (WIP): How many items are currently being worked on?
-
WIP Aging: How long have in-progress items been waiting?
-
Flow Efficiency: How much time is value-adding vs. waiting?
Example: The maintenance team notices that drone repair tasks are consistently exceeding their expected completion time. Their workflow monitoring system, such as the WIP Aging chart, highlights these overdue tasks, sparking a review meeting to improve the process efficiency.
In Businessmap:
These FL1 insights allow teams to take control of their process - and give FL2/FL3 visibility into what's really happening on the ground.
Visualizing weekly throughput levels on a dashboard using the Throughput widget in Businessmap
How to Connect Team-Level Metrics to Strategic Outcomes
Metrics only matter when they connect to impact. Here's how to make the connection across Flight Levels:
-
Link OKRs to Initiatives at FL3
-
Link Initiatives to Coordinated Delivery at FL2
-
Link Delivery Work to Team Boards at FL1
Visualizing flight levels using Businessmap's AI canvas
Example: The FL3 objective "Reduce carbon footprint of drone production by 40%" is linked to a cross-departmental initiative at FL2 ("Switch to biodegradable packaging"), which involves tasks on the Marketing, Manufacturing, and Logistics team boards.
Businessmap enables this connection through:
- Parent-child card relationships
- Linked Workflows
- Workflow Performance Summary dashboards
The Workflow Performance Summary, for instance, helps you:
- Compare performance across teams and workflows
- Monitor delays, throughput, and flow efficiency
- Surface weak links between execution and strategic delivery
This end-to-end traceability ensures that real-time delivery signals feed directly into strategic visibility.
Monitoring key metrics of R&D team using the Workflow Performance Summary widget on a Businessmap dashboard
How to Implement Feedback Loops That Inform Strategic Decisions
Flight Levels aren't just about connecting work; they're about creating feedback loops between work and strategy.
Here's how to implement them:
-
Strategic reviews: Strategy teams (FL3) adjust direction quarterly based on delivery realities
-
Portfolio or initiative syncs: Coordination leads (FL2) synthesize trends, blockers, and risks
-
Team-level retrospectives: Teams (FL1) review flow metrics weekly
Example: In Q2, the drone company sees that the initiative to "Reduce emissions through material redesign" is delayed due to supplier issues. Blockers are flagged in Businessmap, confidence drops on the Outcomes Dashboard, and program and product leaders reprioritize toward a software-based energy optimization initiative instead.
This loop ensures:
- Faster learning
- Better prioritization
- Smarter strategy decisions
How to Use Metrics to Drive Improvement
The real power of outcome-based measurement lies in what you do next.
Use metrics to:
- Spot patterns → Aging WIP across firmware = unclear specs
- Ask better questions → Why is cycle time increasing on high-impact items?
- Set improvement goals → Increase Flow Efficiency by 10% this quarter
- Test changes → Add planning buffers or change entry criteria
Businessmap helps you:
- Track historical vs. current performance
- Cluster blockers by cause
- Visualize work aging trends
- Share dashboards across leadership, coordination, and team levels
Align Metrics with Outcomes, Not Just Activity
What gets measured gets managed - but what you choose to measure defines what you improve.
In Flight Levels, measuring the right things at the right levels means:
- FL3 focuses on business outcomes
- FL2 ensures cross-team coordination and confidence
- FL1 tracks flow to improve speed and predictability
When connected through a single platform like Businessmap, these measurements power a system of visibility, learning, and agility.
That's the heart of outcome-based measurement. Not more reports. Just better decisions, faster.
Ready to see Businessmap in action?


 An executive Initiatives & Outcomes dashboard in Businessmap
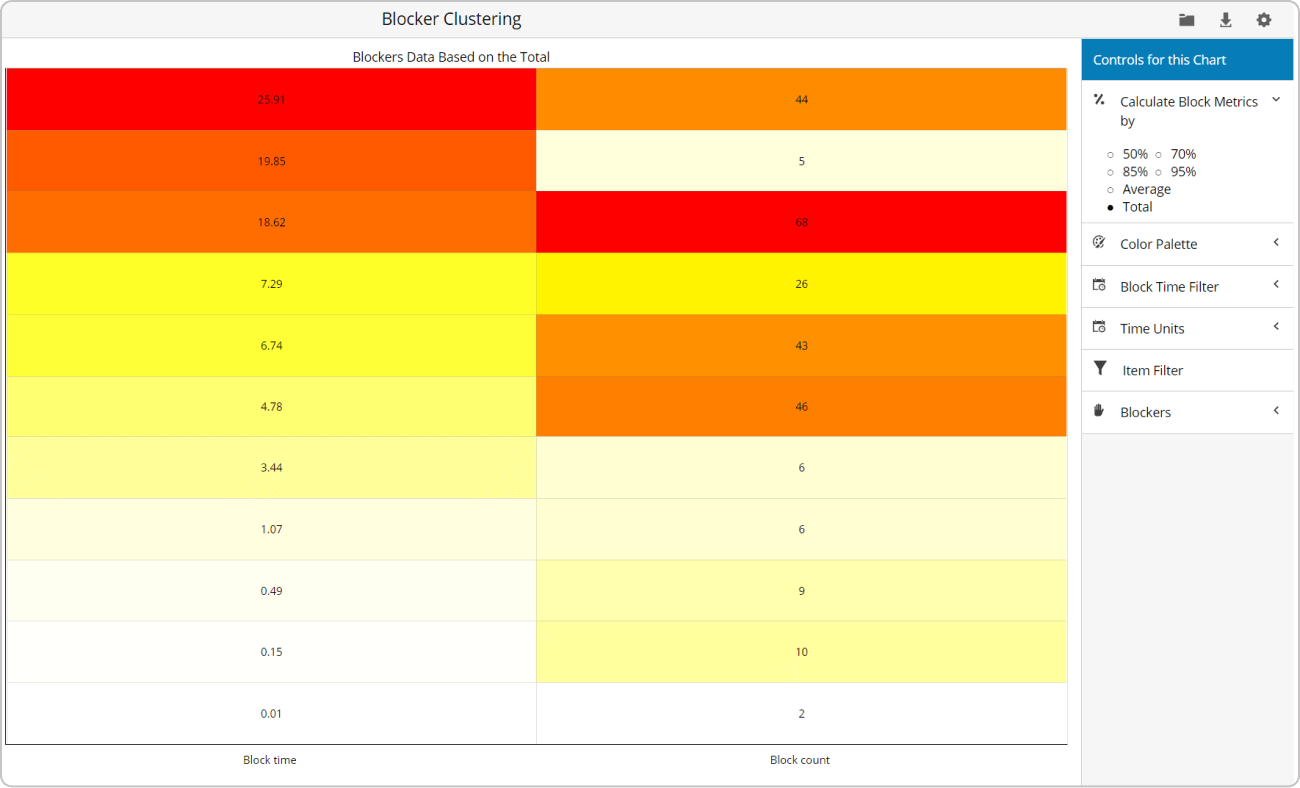 Analyzing process blockers using the Blocker Clustering chart in Businessmap
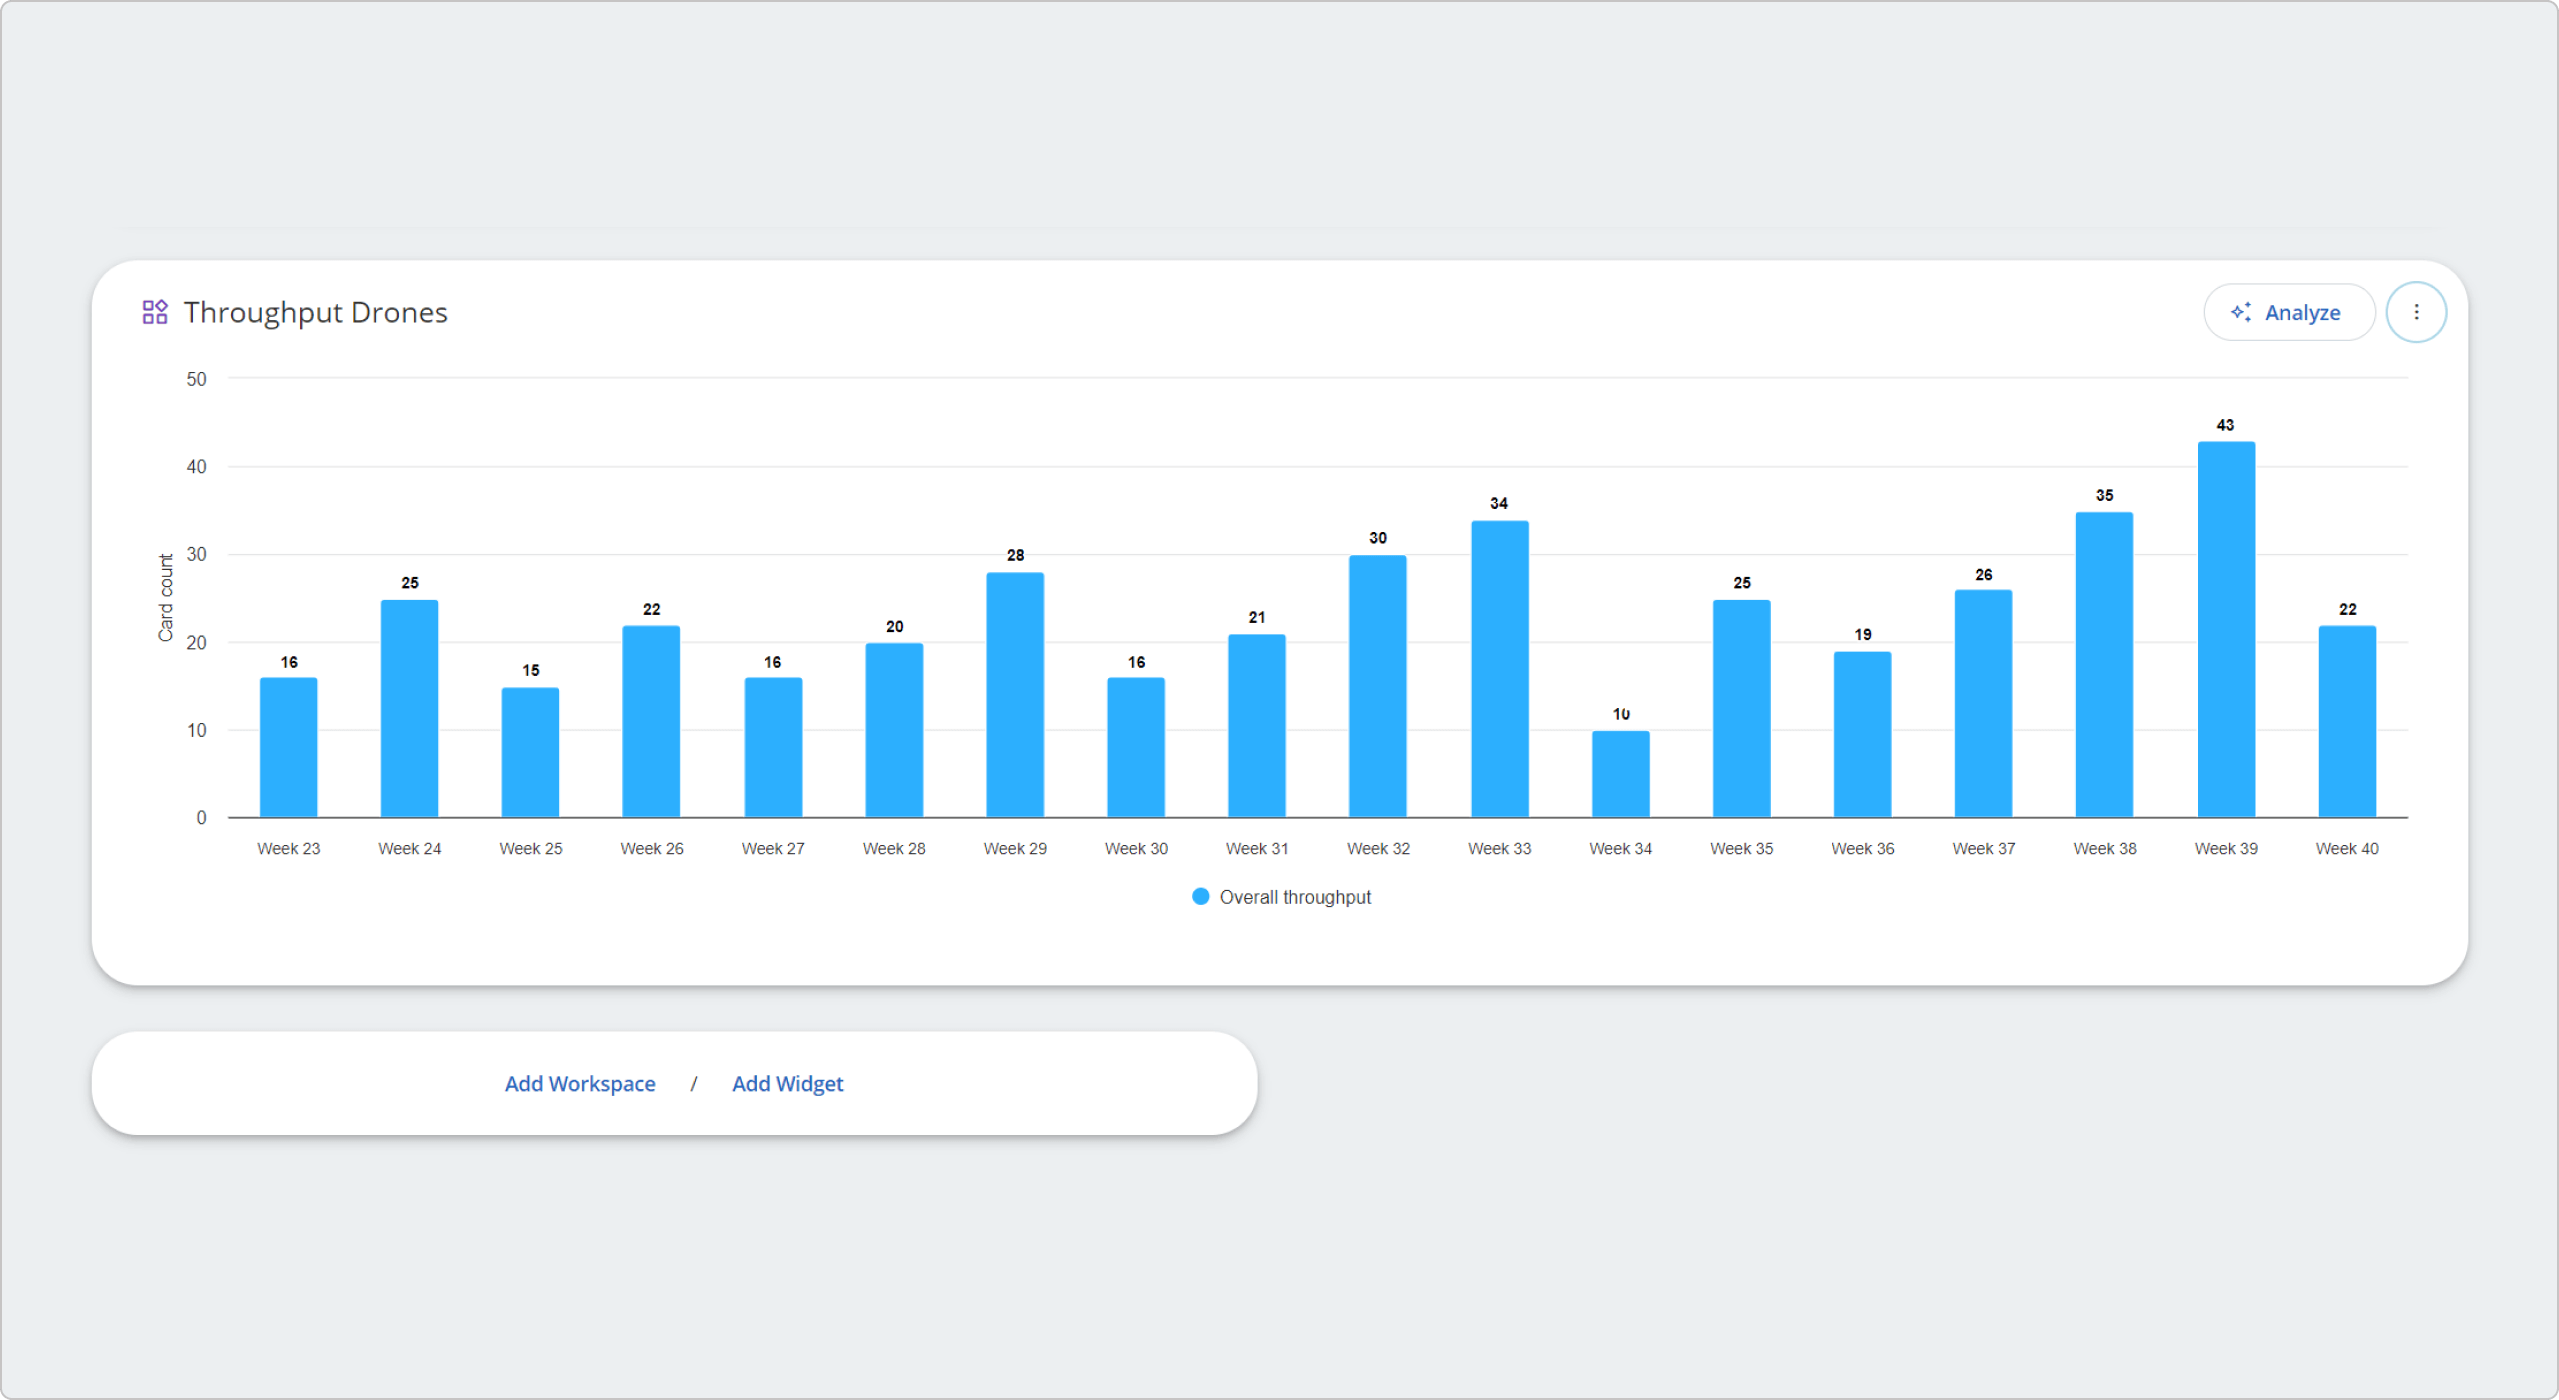 Visualizing weekly throughput levels on a dashboard using the Throughput widget in Businessmap
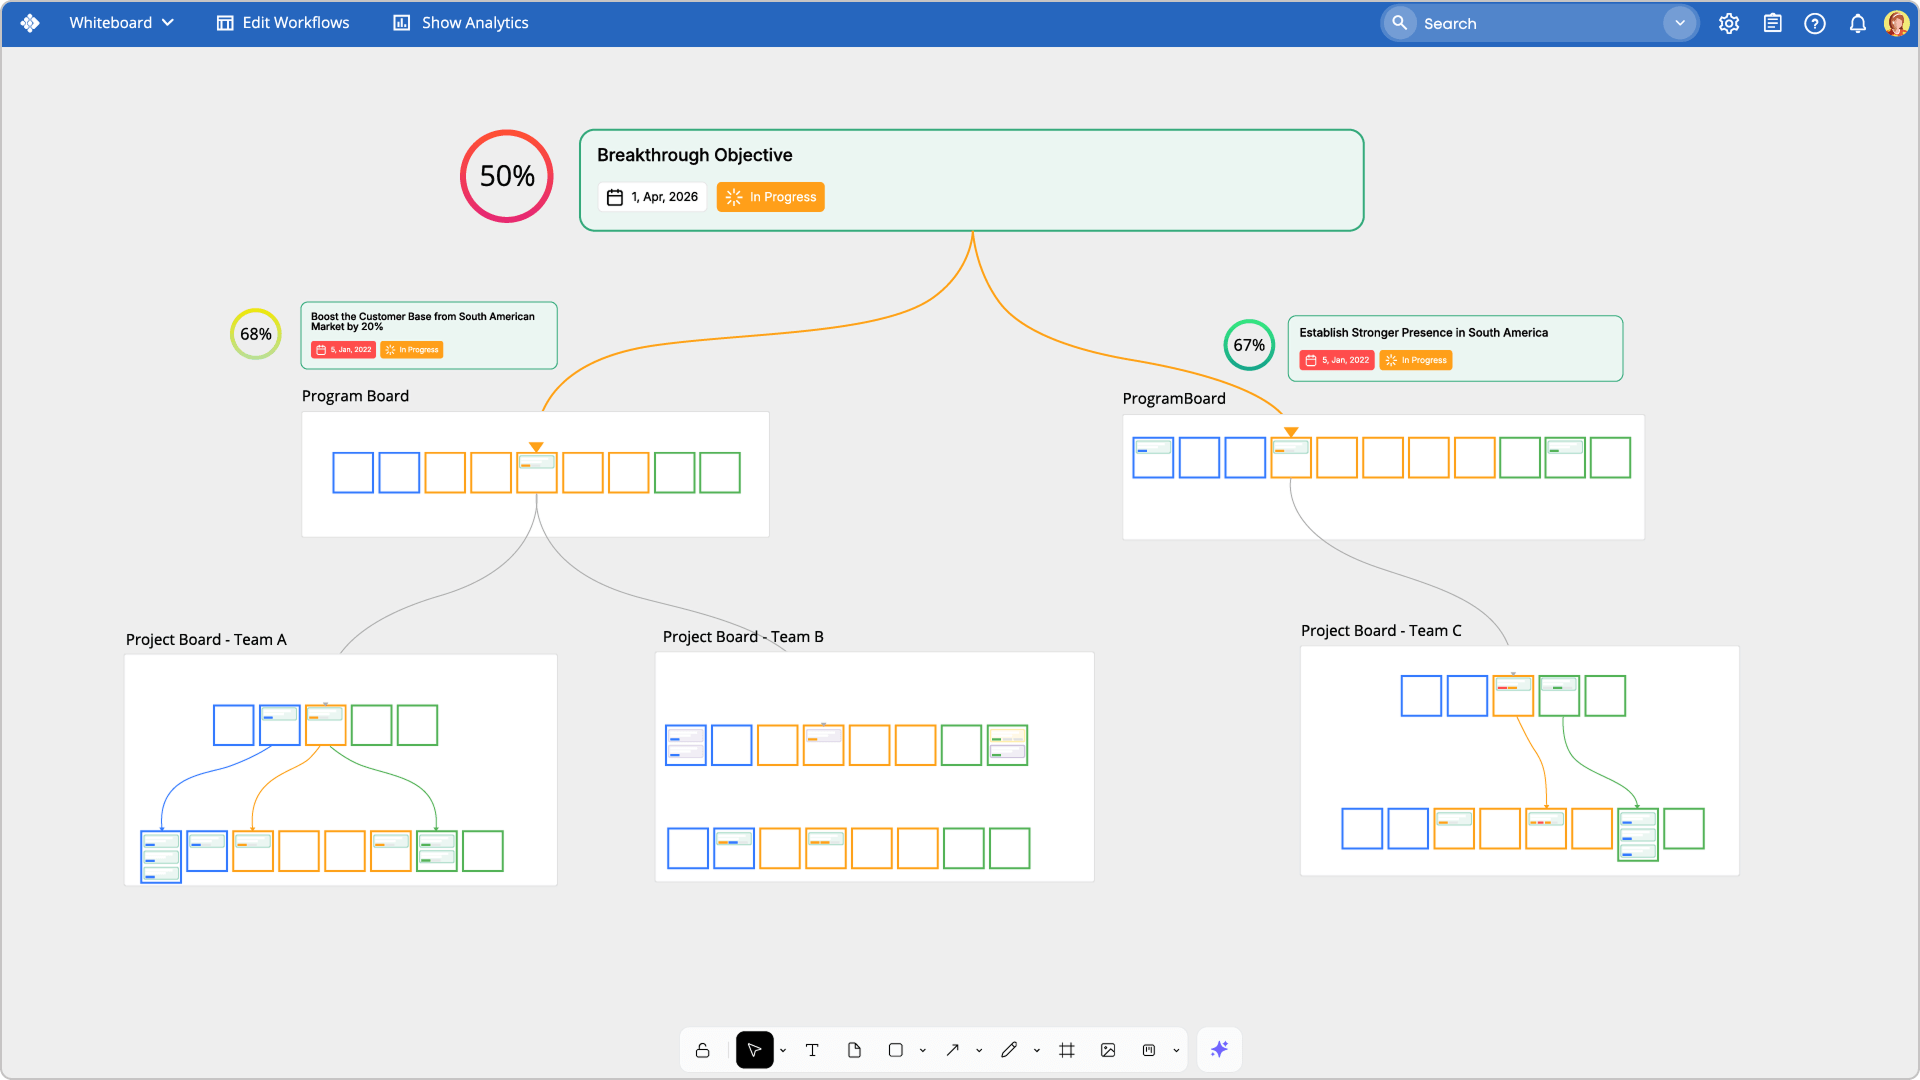 Visualizing flight levels using Businessmap's AI canvas
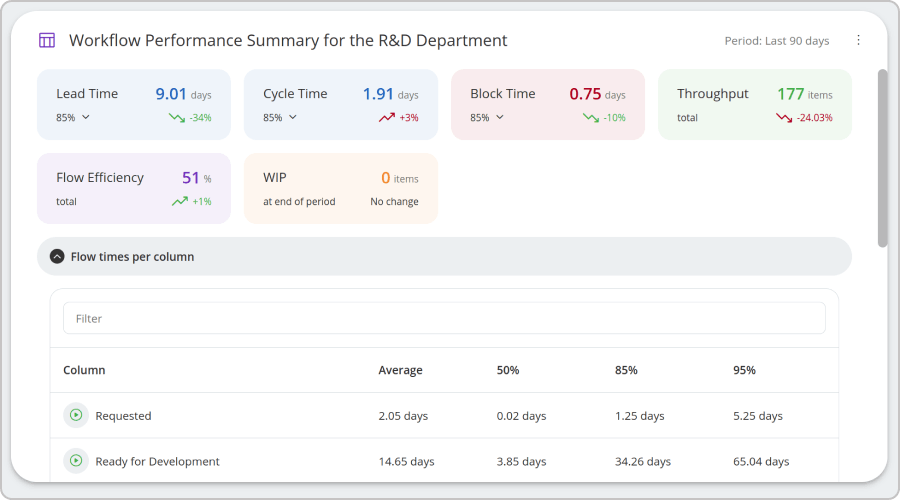 Monitoring key metrics of R&D team using the Workflow Performance Summary widget on a Businessmap dashboard