Key Takeaways
- The fishbone diagram is a proven visual tool for identifying, organizing, and analyzing the potential causes of a problem.
- Invented by Kaoru Ishikawa, it remains a cornerstone of root cause analysis in Lean, Six Sigma, and quality management.
-
Effective fishbone diagram analysis requires focusing on meaningful causes, using relevant categories (like the 6Ms), and combining it with other tools like the 5 Whys to validate findings.
What Is a Fishbone Diagram?
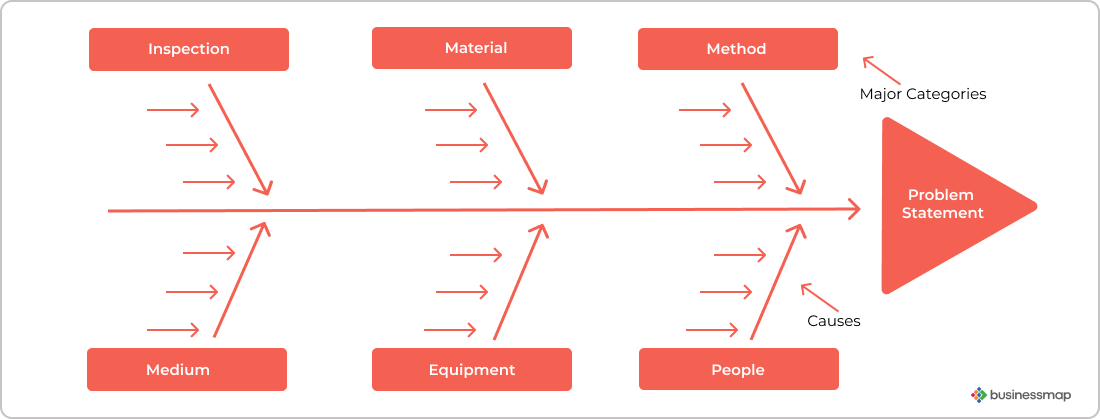
The fishbone diagram, also known as the cause-and-effect diagram or Ishikawa diagram, is one of the classic tools in quality management. It's shaped - unsurprisingly - like a fish skeleton, with the "head" representing the problem you're trying to solve, the "bones" showing major cause categories, and the "ribs" branching off to represent sub-causes.
It was developed in the 1960s by Kaoru Ishikawa, a Japanese quality control pioneer, to help manufacturing teams at Kawasaki shipyards think more systematically about the factors that lead to defects. Since then, the fishbone diagram has become one of the seven basic quality tools and is used far beyond manufacturing - in healthcare, service industries, IT, and process improvement work of all kinds.
What Is the Purpose of Using a Fishbone Diagram?
The fishbone diagram's goal is straightforward: to identify the potential causes of a problem so you can address them at the root, not just treat symptoms. By facilitating RCA workshops, the value of fishbone diagram analysis comes from its ability to get a team's ideas out in the open and into a structured, visual format.
When a cross-functional group sees their collective thinking mapped onto one diagram, they can quickly spot patterns, connections, and even blind spots. This makes it easier to prioritize which causes are worth deeper investigation and which might be contributing noise rather than insight.
 Visualizing the essential components of a fishbone diagram
What Are the Advantages of the Fishbone Diagram?
Fishbone diagrams bring benefits to process improvement as well as problem-solving thanks to their visual comprehensiveness. Here are a few of the underlined advantages the tool has to offer.
-
Visually represents a problem statement, its major causes, and supporting sub-causes.
-
Supports brainstorming ideas by visually representing them in a single hub.
-
Offers a global view into the state of a problem available to team members and stakeholders alike.
How to Interpret Complex Fishbone Diagrams with Multiple Causes
Simple diagrams are easy to read - one problem, a few major categories, and some obvious sub-causes. But real life isn't always so neat. Complex problems often have dozens of contributing factors, and mapping them all can result in a crowded diagram.
When reviewing a dense fishbone diagram:
-
Focus on clusters of sub-causes. If a particular bone has far more "ribs" than the others, it may be a hotspot worth investigating.
-
Look for cross-category themes: for example, "training gaps" might appear under both "Manpower" and "Method."
-
Don't assume every listed cause is equally important. Use follow-up methods like the 5 Whys or Pareto analysis to validate which causes truly drive the problem.
What Cause Categories Are Commonly Used?
In manufacturing and Lean contexts, the 6Ms framework is a popular starting point to navigate the process of defect identification. The method helps to determine the sources of variations in a process and to reach the root cause.
| Category |
What It Covers |
| Manpower |
Skills, training, workload, human error |
| Method |
Processes, procedures, workflows |
| Machine |
Equipment, tools, technology |
| Material |
Raw materials, components, consumables |
| Medium (Environment) |
Physical environment, weather, noise, temperature |
| Measurement |
Inspection, calibration, metrics |
In other industries, these categories are adapted. For example, in software development, you might replace "Machine" with "Technology Stack," or in service industries, "Material" might become "Information."
What Are the Examples of a Fishbone Diagram?
You can use a fishbone diagram for investigating accidents at the workplace. The brainstorming of causes from various team members' perspectives is an essential asset in analyzing the situation. The approach allows the uncovering of the root cause of the accident, but also encourages improvement efforts and guides the development of a corrective action plan.
Manufacturing also uses the Ishikawa diagram to investigate root causes of problems. In the example diagram below, an assembly line production process is found to be inefficient. The analysis team has agreed on the problematic statement, the major involved categories of causes have also been determined using the 6Ms framework, and potential causes have been identified through brainstorming. All the elements have been mapped at the designated place on the diagram.
Mapping analysis of an assembly line production process inefficiency on a fishbone diagram
How to Create and Use a Fishbone Diagram Effectively
A good fishbone diagram starts with a clear, agreed-upon problem statement at the head of the diagram. From there, you draw the spine, add major cause categories as the big bones, then brainstorm potential causes under each category. Sub-causes branch off like smaller ribs.
During workshops, it is useful to:
-
Facilitate brainstorming in rounds, starting with major causes and then moving to sub-causes.
-
Encourage input from every participant, especially those closest to the work.
-
Use sticky notes or a digital whiteboard tool so ideas can be easily moved, regrouped, or removed.
Once the diagram is complete, the team should review it critically. Which causes are plausible? Which can be supported with data? Which needs further investigation?
Common Pitfalls in Fishbone Diagram Use
The best diagrams are focused, collaborative, and data-informed. Avoid these pitfalls:
-
Overloading the diagram with irrelevant causes (this can happen in unfocused brainstorming).
-
Treating the diagram as the final answer instead of a starting point for deeper analysis.
-
Failing to revisit and update the diagram as new information emerges.
We've all seen teams fill out a beautiful diagram, pin it to a wall, and never look at it again - which defeats the purpose. The fishbone should evolve alongside your understanding of the problem.
Are There Templates or Tools That Support Fishbone Diagramming?
Yes - and the choice depends on your needs. For quick sessions, nothing beats a whiteboard or flip chart. For remote or distributed teams, tools like Miro, MURAL, Canva, or Lucidchart work well. If you want your fishbone diagram to be part of a continuous improvement system, Lean/Agile tools like Businessmap let you link causes directly to actions and track whether they've been addressed.
Templates are also widely available - from simple printable outlines to fully customizable digital formats. A good template will already have the backbone, problem head, and cause branches laid out so you can focus on the content.
What Are the Other Tools to Increase Work Efficiency Similar to the Fishbone Diagram?
The Lean philosophy introduced a range of tools that support not only problem-solving and decision-making but also workflow efficiency and process improvement. Some of the techniques, such as Fishbone diagrams, which directly impact workflow efficiency, are listed below.
Businessmap is the most flexible software
to achieve full work visibility across teams and portfolios


 Visualizing the essential components of a fishbone diagram
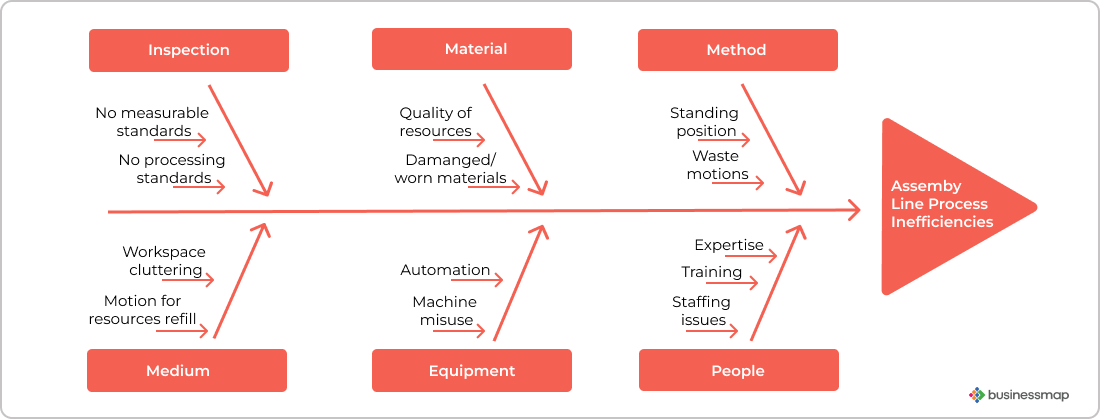 Mapping analysis of an assembly line production process inefficiency on a fishbone diagram