SCHLENK is an international family business and one of the leading manufacturers of metal powders, pigments, and foils. Headquartered in Roth, Bavaria, it has production sites in Europe and the US and technical service centers in Germany, the US, China, and Southeast Asia. Its products serve the coatings, plastics, printing, building materials, and chemicals industries. In 2015, SCHLENK set out to find a better way to manage its R&D projects.
The challenge: Big batches, slow handoffs, and outdated status reports
Pigments and coatings is a heavily regulated industry with long innovation cycles. Each product goes through many rounds of development and testing before it can be sold, and frequent experiments are expensive. Like most companies in the field, SCHLENK managed R&D with a Stage-Gate® process, supported by its own spreadsheets.
Working in large batches caused problems:
- Slow handoffs: teams and project phases weren’t connected, so work piled up between stages and departments.
- No visibility: related work and blockers were hidden, so people didn’t know what they were waiting for.
- Outdated status: detailed milestone plans quickly fell out of date, and there was no current view of project performance.
- No way to improve: without data on how work actually flowed, the process couldn’t get better over time.
SCHLENK considered a consulting project to add Gantt charts to its Stage-Gate process, but judged it too bureaucratic, slow, and expensive. When it formed a new team to develop new technology, management looked for a different approach.
What changed
Kanban, digital from day one
SCHLENK chose the Kanban method to connect project stakeholders and create a smooth workflow. It skipped physical boards and went straight to digital, so everyone could see project work from anywhere. After comparing several Kanban tools on ease of implementation, workflow transparency, and quality of support, it chose Businessmap's Kanban solution.
Once every team’s work was on a board, everyone could see what was in progress, who depended on it, and what was coming next. Blockers and dependencies became visible.
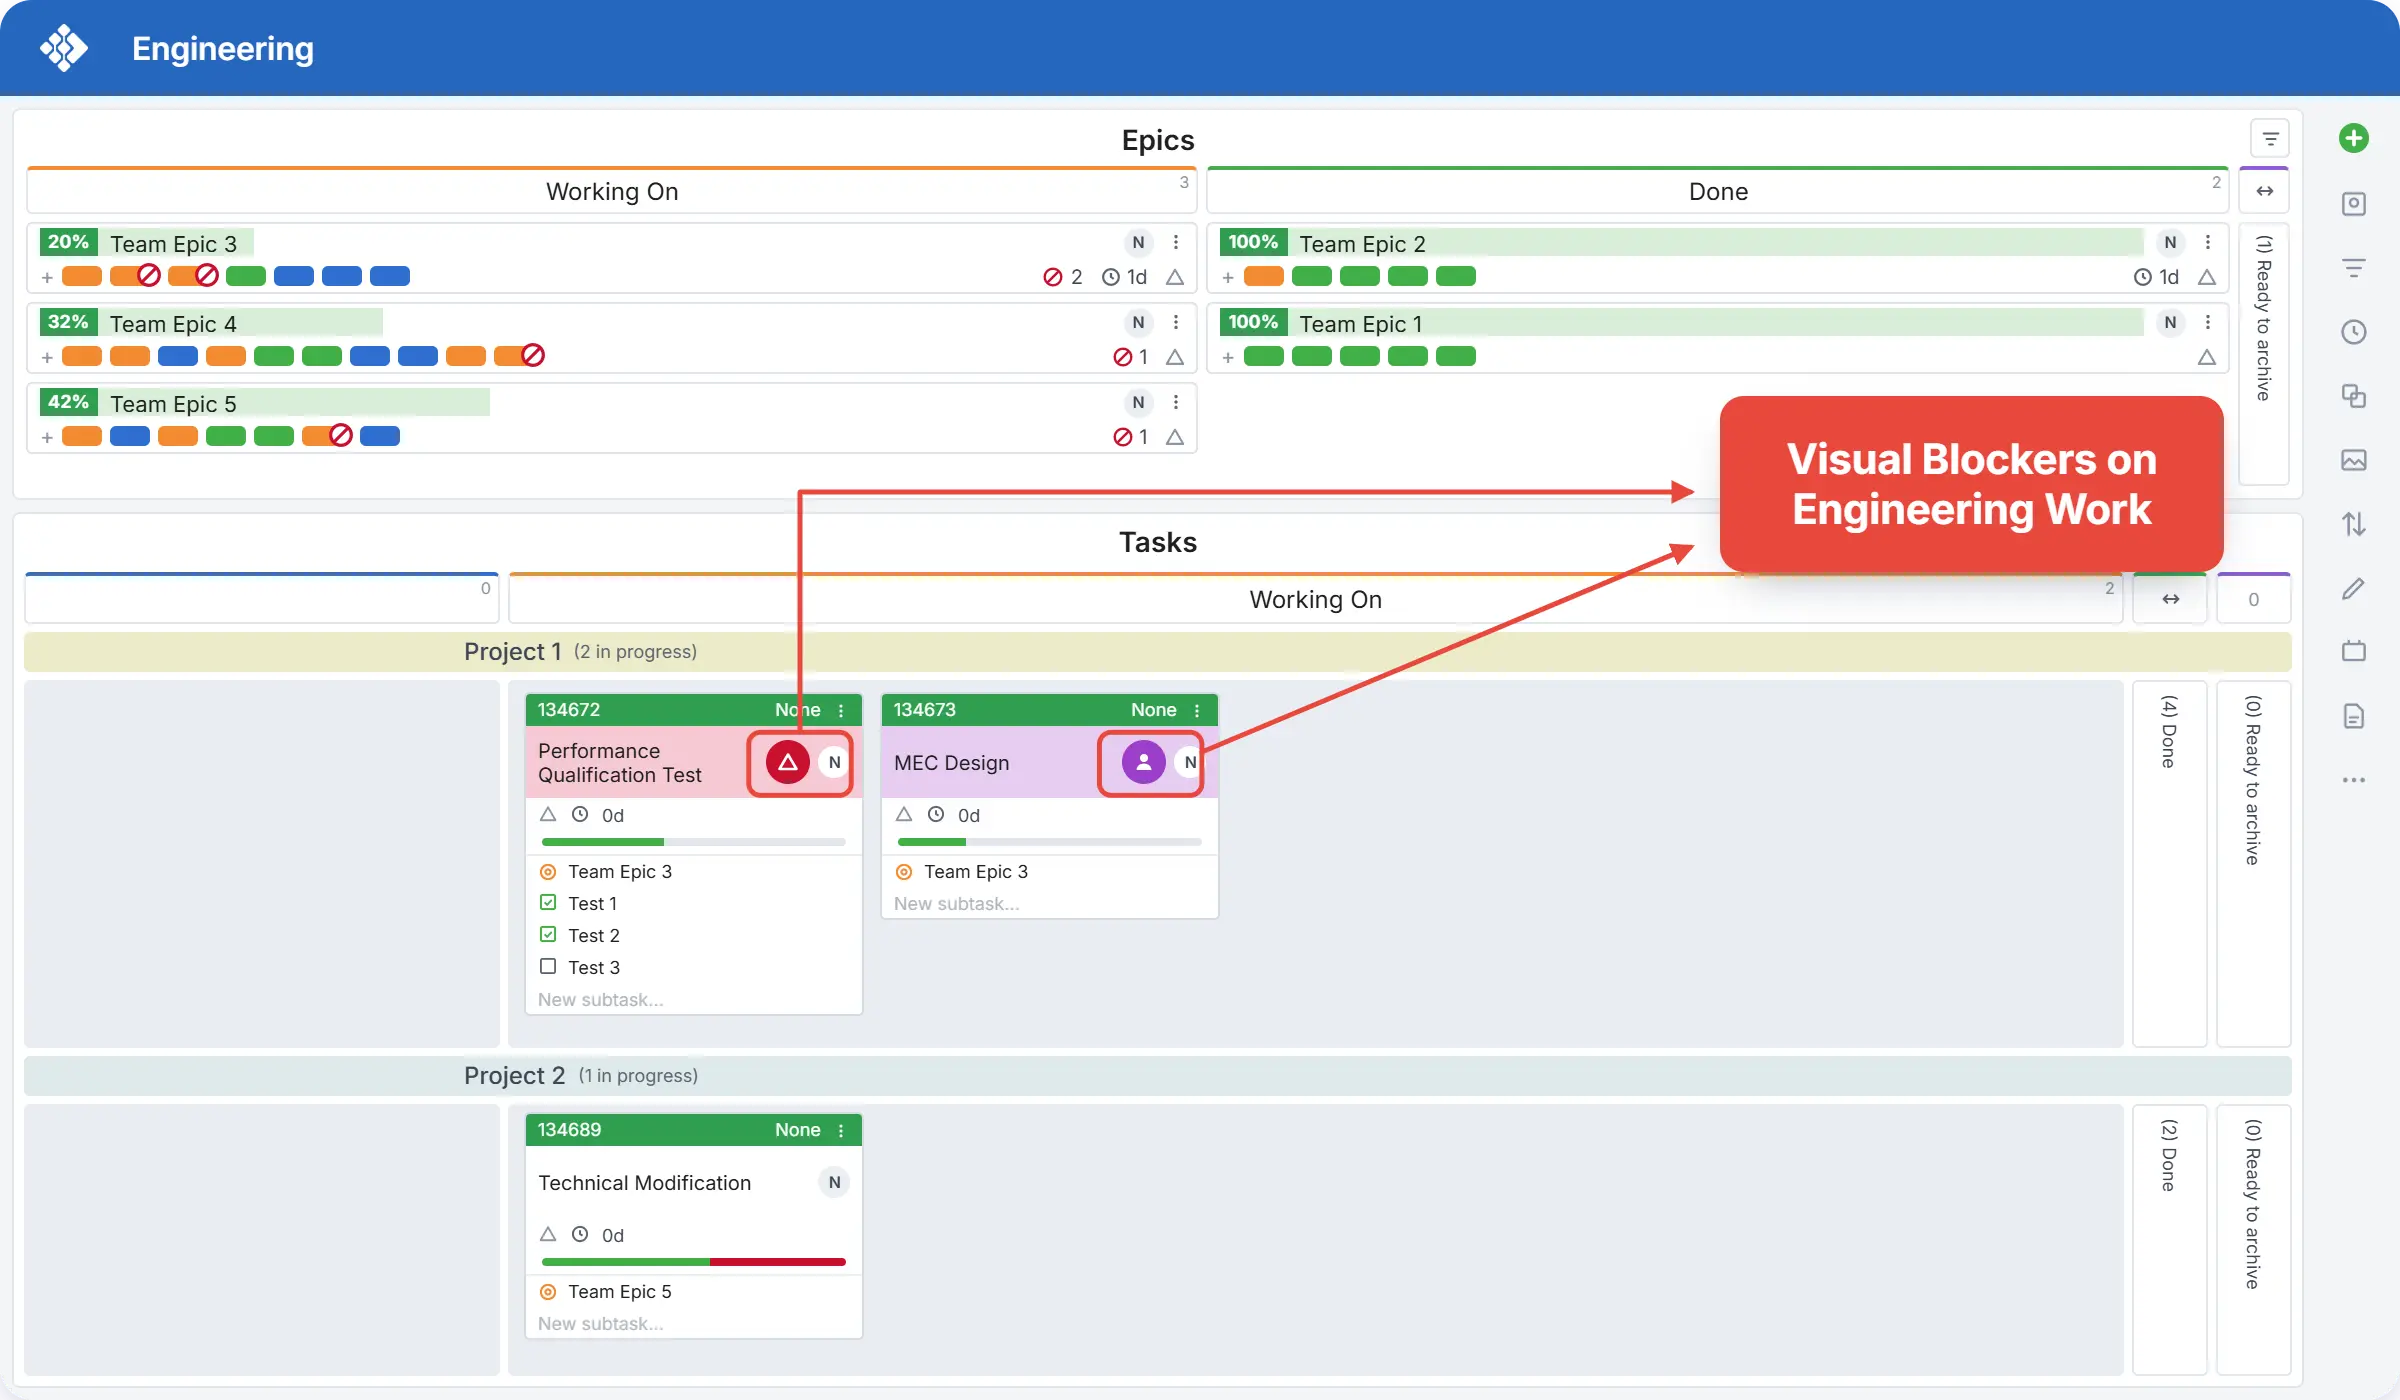 Visualizing blocked work items on engineering team board in Businessmap
Three connected levels, from portfolio to tasks
Using Klaus Leopold’s Flight Levels model, SCHLENK built three connected levels in Businessmap:
- Portfolio board: the pipeline of strategic R&D initiatives and their subprojects.
- Portfolio Workspace: coordination between Engineering, Laboratory, Analytics, Application Technology, Sales, and Marketing.
- Team boards: each team breaks project work into tasks and moves them through its own workflow.
Tasks are linked to their projects, and projects to their initiatives. When a task moves, the progress of its project and initiative updates automatically, so the portfolio board serves as a real-time status report.
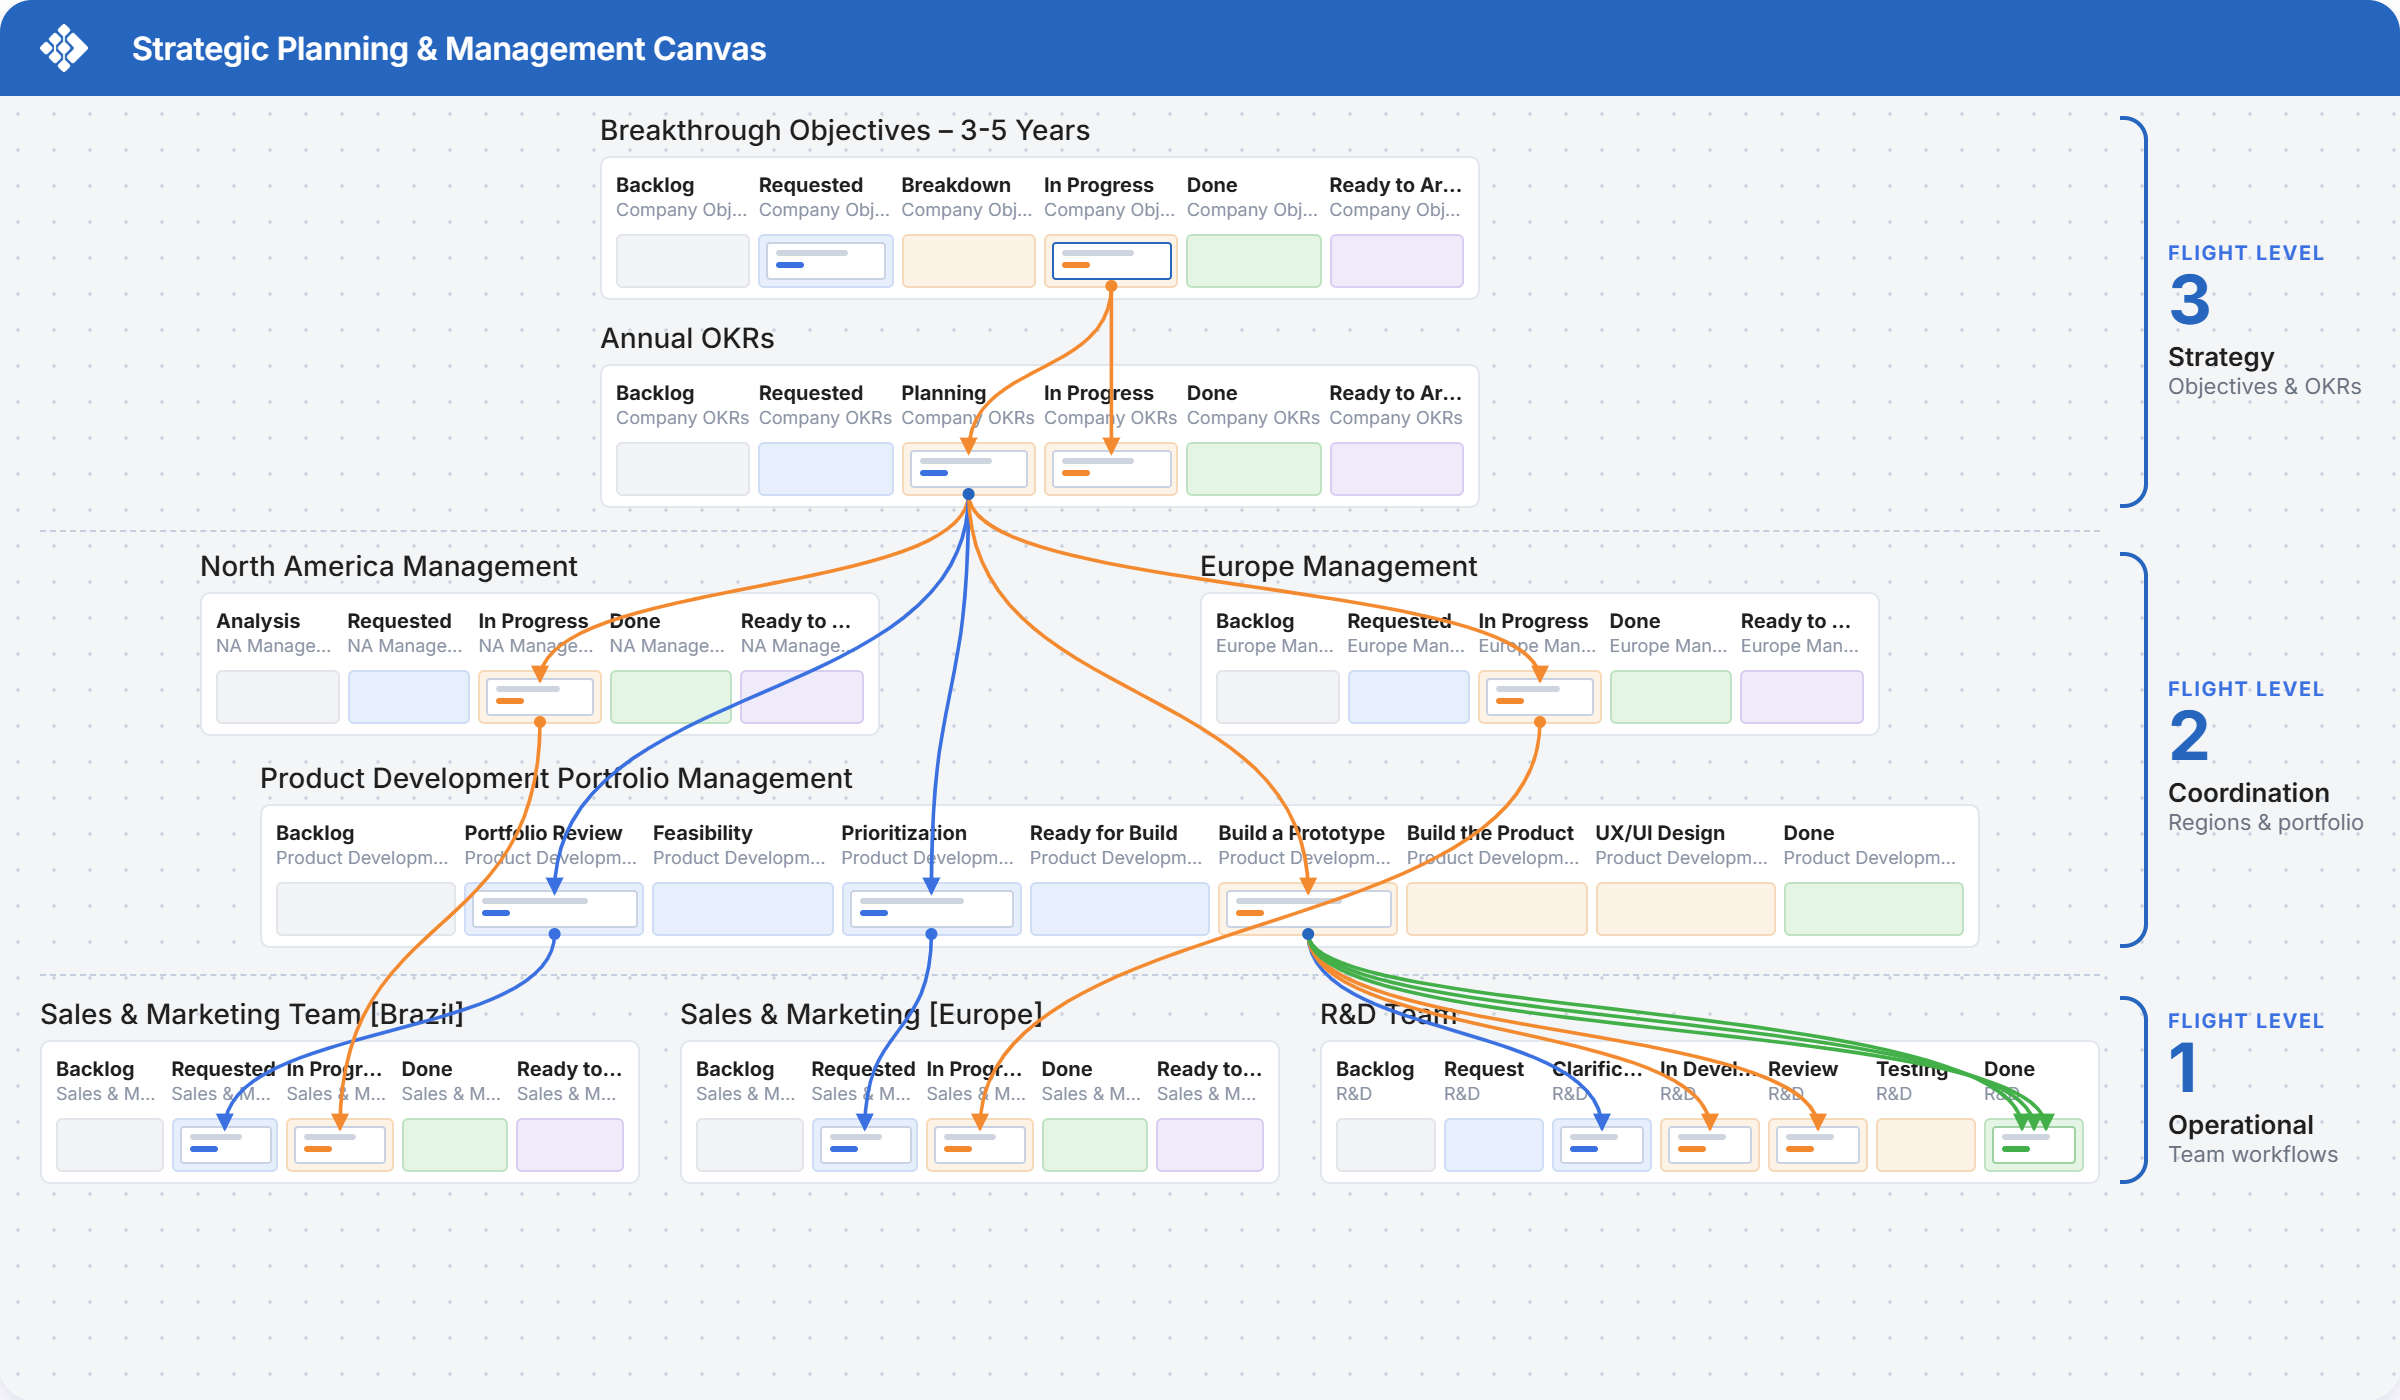 A diagram of the three flight levels and how they are linked - strategy goals, coordination level and team boards, on a Businessmap whiteboard
Faster handoffs between departments
For the first time, every department worked in the same system. The difference was clearest between the Chemistry and Analytics teams. Chemists used to ask and wait for updates on lab results; now they see the moment results are ready. When a team blocks a card, the blocker shows on the parent initiative and on the workspace dashboard, so managers immediately see where a project is stuck.
Data-driven fixes that cut cycle time
SCHLENK’s teams use Businessmap’s Kanban analytics to find and fix delays:
- Cycle time scatterplot: teams study outliers to learn what caused delays and remove the cause.
- Cumulative flow diagram: it revealed that one team did most of its work just before review meetings, with work stalling in between. Switching to smaller, more frequent meetings smoothed the flow and lowered cycle time.
- WIP limits: limiting how many tasks a team works on at once had the biggest impact. In one team, cycle time at the 85th percentile fell from 110 to 44 days, and throughput rose.
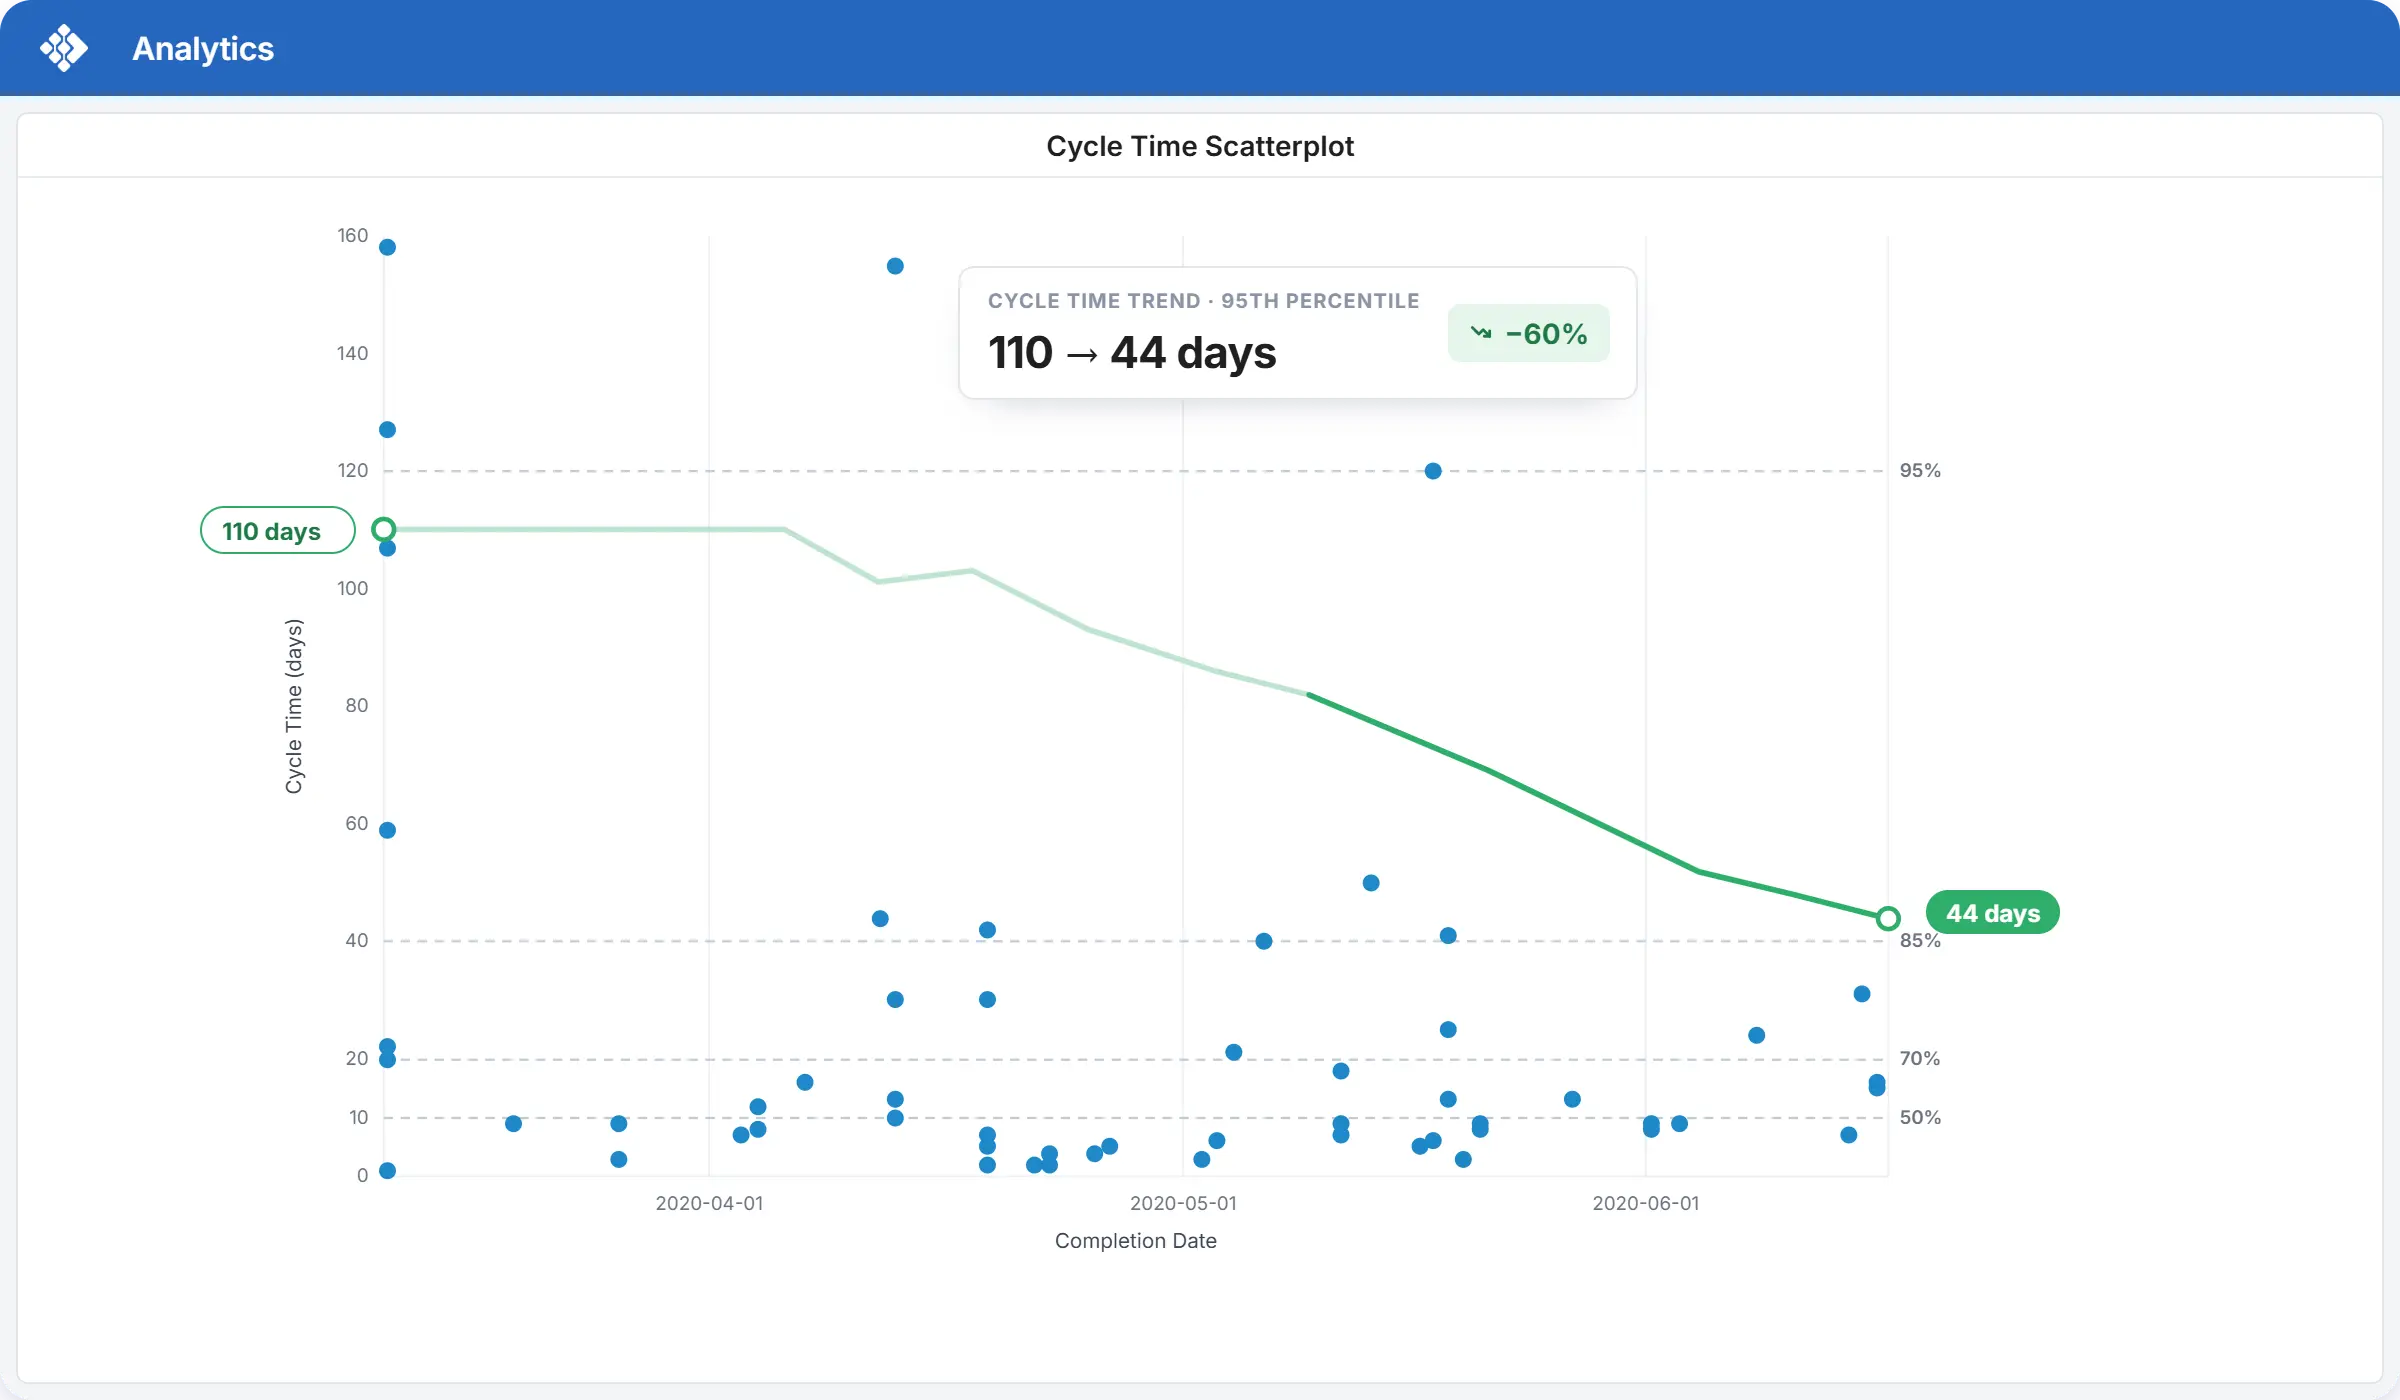 A cycle time scatterplot in Businessmap showing a 110 to 44 day drop
The Analytics department also uses the platform’s data to report to senior management, with no manual data collection or document preparation.
The impact: A system every user found useful
A few months after rollout, SCHLENK surveyed its users. They highlighted:
- A clear overview of their workload and their colleagues’ tasks
- Priorities that flow easily from management to teams
- Information and bottlenecks spotted just in time
- Better idea management through a shared backlog
- Easy handover of work between part-time staff
There was almost no resistance to the new tool, and people encouraged colleagues to use it more. Unlike other tools whose benefits seemed to go only to management, every user saw benefits in their own daily work.
Overall, SCHLENK achieved:
- Cycle time down 60% in one team, from 110 to 44 days, with higher throughput.
- Real-time portfolio status, built automatically from team-level work.
- Shorter waits between departments, especially Chemistry and Analytics.
- Faster resolution of blockers, wherever they occur.
- No more manual reporting for the Analytics department.
SCHLENK has since invited a supplier onto its boards to improve coordination and information sharing, and plans to invite a customer next.



