AK Gıda, part of Groupe Lactalis, is Türkiye's largest producer of milk and dairy products. It is headquartered in Istanbul and runs six plants across the country, producing milk, kefir, fresh cheese, and puddings under the İçim brand. Its IT department of around 40 people supports the whole business. With partner AgileMind, it rebuilt how it takes in, plans, and delivers work.
The challenge: Scattered projects and dependencies nobody could measure
CIO Mehmet Belgen wanted the IT department to deliver faster, but the way it worked made that hard:
- Low transparency: it was hard to see what was in progress across the department.
- Scattered work: project activities were spread across several systems.
- Dependencies: internal and external dependencies caused delays that no one could measure.
- Many projects at once: the team juggled several internal and external projects in parallel.
Vendors were a particular problem. Engineers knew external suppliers were holding up work, but they couldn't show which vendor caused the most delay, or whether service-level agreements were being met.
From Scattered Work to Embracing a Hybrid Approach with Businessmap
A guided Lean/Agile transformation
Mehmet brought in Murat Elmas from AgileMind, a Lean/Agile consultancy and Businessmap partner. Together they set three goals:
- Break down silos between functions via Lean/Agile practices
- Digitalize all work (projects, features, activities) to gain a better view of the value stream
- Manage internal and external dependencies with real data
Regarding Lean/Agile ways of working, the IT department's first step was understanding their current process and identifying different work types. Workshops on Value Stream Mapping and STATIK, a structured approach to introducing Kanban, helped the department map how work actually flowed.
They found two distinct services:
- A process for taking in requests from the business units
- The main process for delivering projects
The teams chose a hybrid approach: Kanban for analyzing requests and managing projects, and Scrum in two-week sprints for delivering the work.
One front door for every request
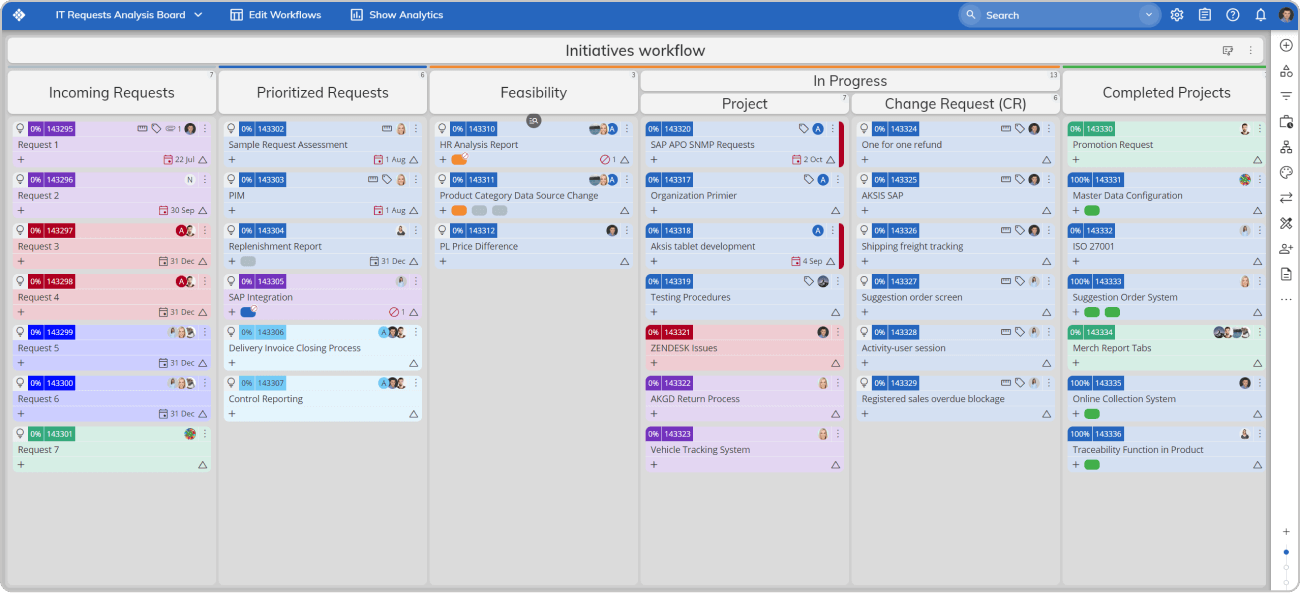
The first service that the IT department visualized inside the Businessmap platform was the process of gathering new requests from other business units. With the help of a dedicated board, the team structured a workflow that serves as a "pool of ideas". This created an Upstream Kanban implementation within the department where every request goes through a set of analysis steps to determine whether it is a project or a smaller activity such as a "Change Request".
Three levels of work on one board
Approved work moves to the main department board, which holds a full work breakdown structure:
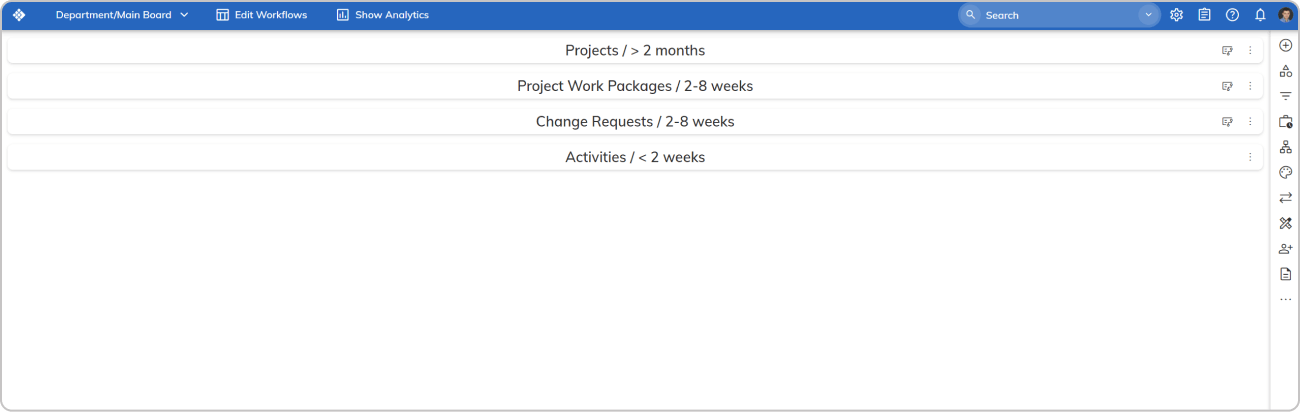
1. Project Level is where all project-related requests from other business units go through. The teams agreed to turn any requests into a project if it took more than 2 months.
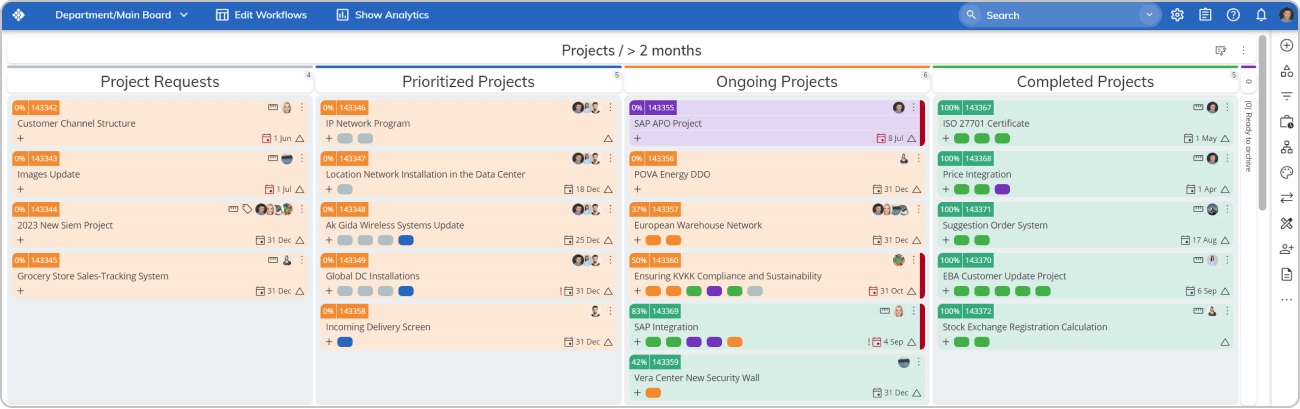
2. Packages & Change Request Level is where all smaller projects, change requests, or deliverables take between 2 weeks and 2 months.
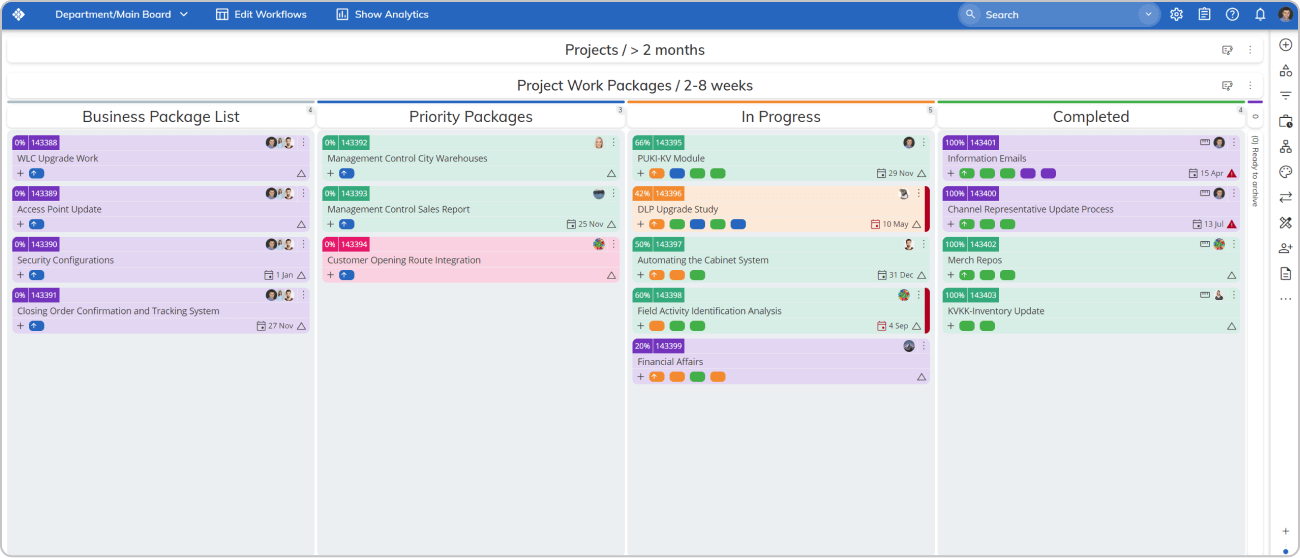
3. Activities Level serves as the flow for daily task management. All work activities here are children of smaller change requests or larger projects and shouldn't take more than 2 weeks.
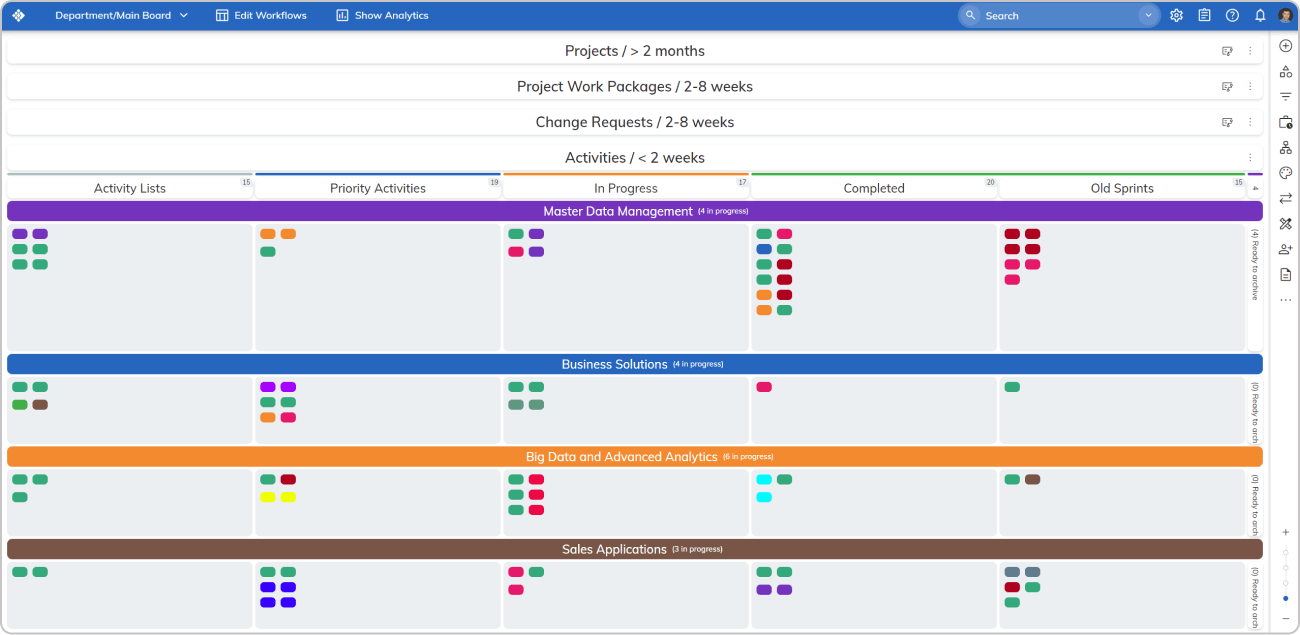
The CIO and project managers can now see in one place who is working on what, and where each piece of work comes from.
Every vendor tracked as a blocker
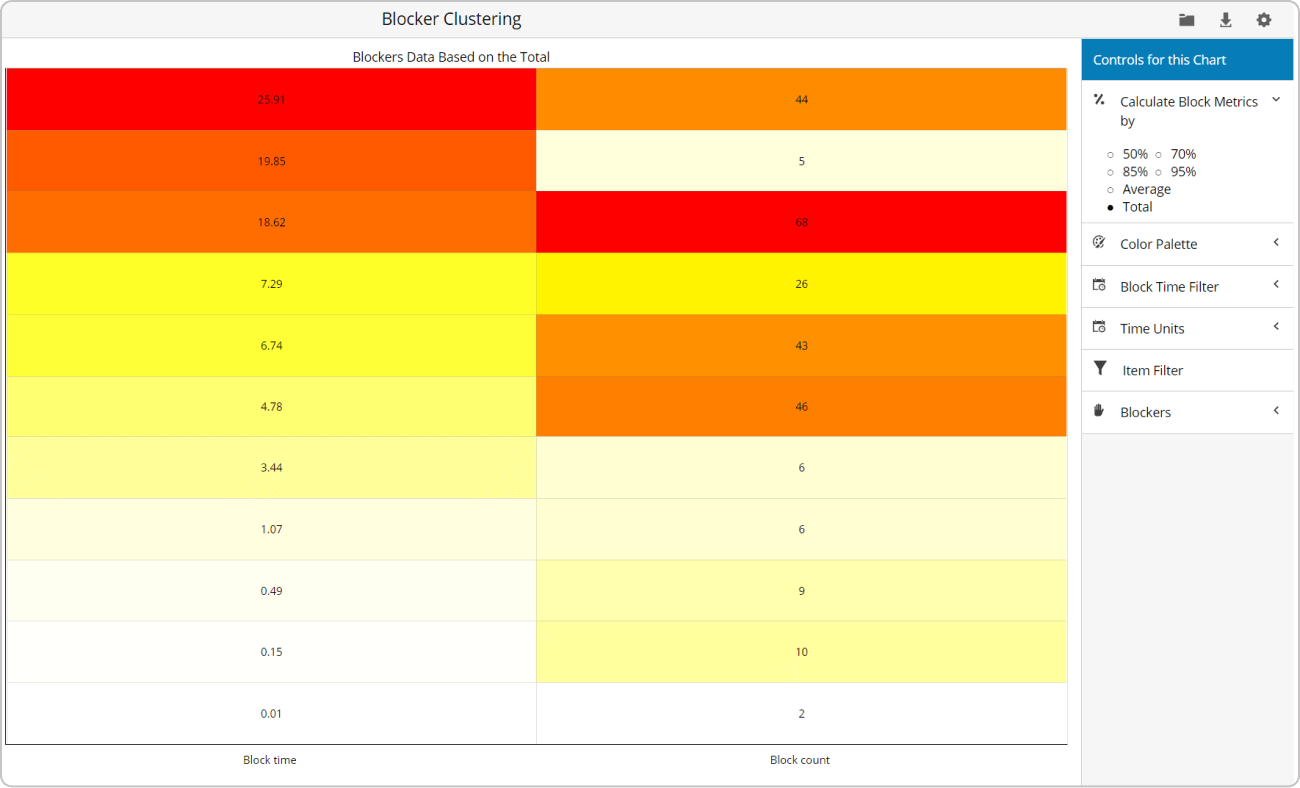
At Murat's suggestion, the team created a blocker for each vendor. When work waits on a supplier, engineers mark it as blocked by that vendor. The Blocker Clustering chart shows which dependencies cause the most delay. AK Gıda now uses this data in conversations with suppliers, which cut supplier-related blocked time by 21%.
Flow metrics set delivery expectations
Any Lean/Agile transformation would be incomplete if it's not properly measured.
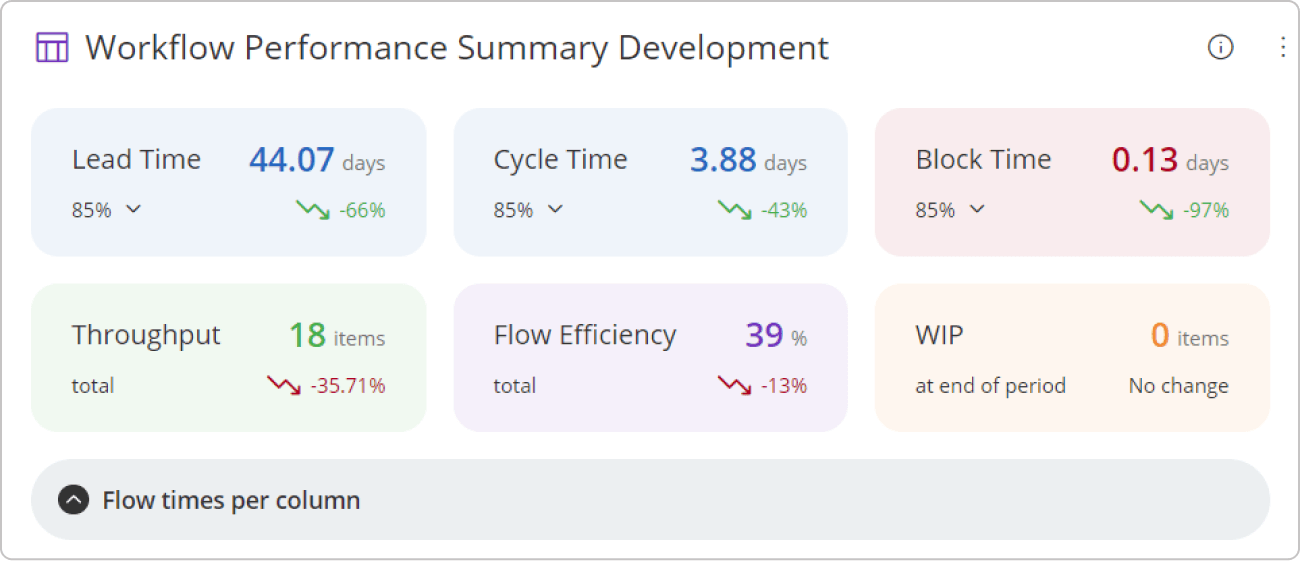
That's why the department tracks lead time, cycle time, and throughput.
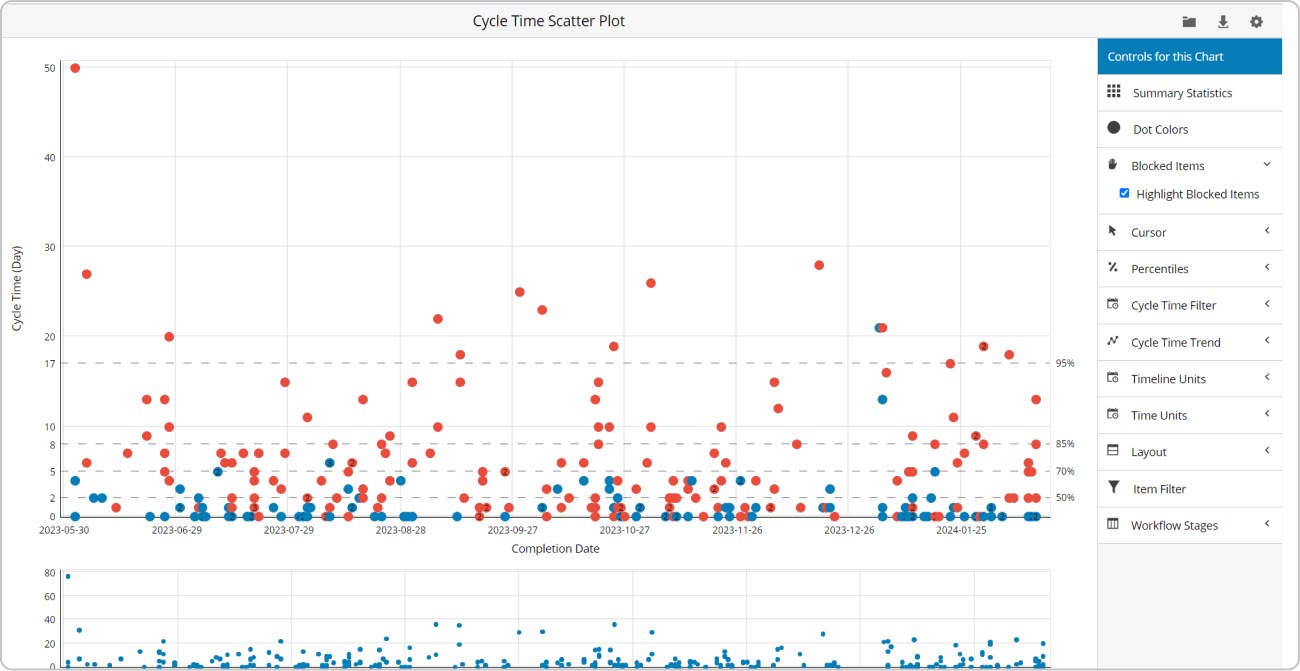
The Cycle Time Scatterplot, for instance, shows how long 85% or 95% of items take, which the team uses to set service level expectations for new work.
Senior managers use the Workflow Summary Performance dashboard to compare key delivery metrics with previous periods.
The impact: Faster, measurable delivery across IT
The IT department achieved:
- 54% faster cycle time across its delivery process.
- 21% less time blocked by suppliers, after vendor delays became measurable.
- End-to-end visibility from incoming requests to daily tasks.
- Delivery expectations based on data, not estimates.
- Fact-based supplier conversations that support continuous improvement.
Future plans
As the company is committed to continuous improvement, AK Gıda is now looking to implement Lean/Agile ways of working combined with the Businessmap platform across other business units.
Implemented with AgileMind
AgileMind helps organizations, teams, and individuals improve how they deliver long-term value, using agile principles and practices to enable change. agilemind.com



